Creating dashboards
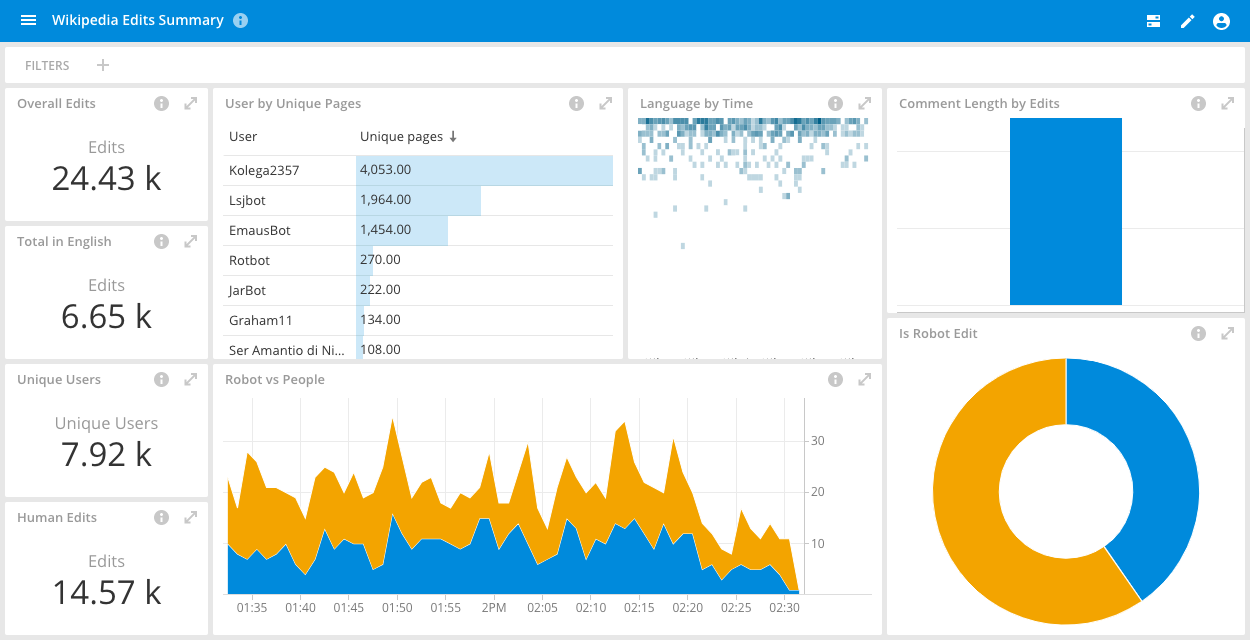
In this tutorial, you will build a dashboard based on the Wikipedia data cube that you might have created if you completed the Imply Quickstart:

Add an initial dashboard tile
You must build a dashboard one tile at a time. In a data cube, start by creating a view that you want to add to your dashboard. For example, the above dashboard includes a tile for the overall number of edits that you see when you open your Wikipedia data cube. From your data cube, click the Add to dashboard icon in the top navigation panel, and select Create new dashboard:

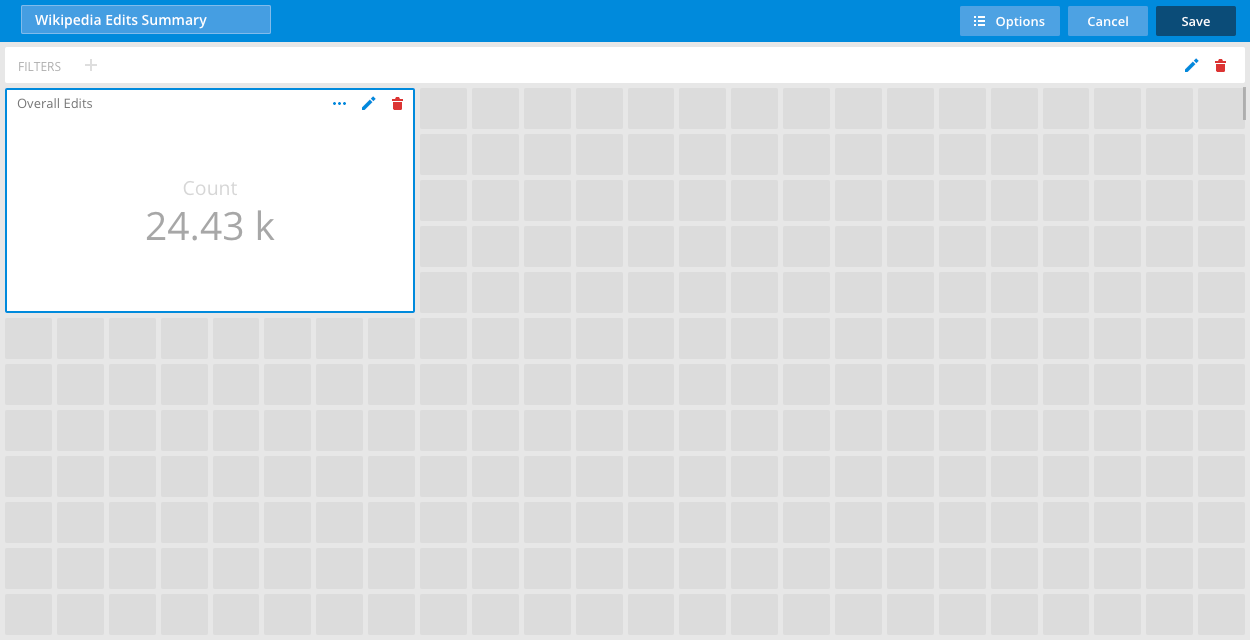
Now that you have added your first tile to a new dashboard, you can title the dashboard by replacing New dashboard with "Wikipedia Edits Summary."
Next, click the Edit icon in the tile to open the tile menu. In the Title field of this menu, enter "Overall edits." The tile menu contains additional settings. For example, you can change the tile's visualization type in the Content field, specify the Data cube it comes from, add a Filter, and more.
You must save your new dashboard by clicking Save.
Add additional tiles
You can add as many tiles to your dashboard as you want. Here are descriptions for creating tiles similar to those in the "Wikipedia Edits Summary" dashboard from the Wikipedia data cube. They all use a Latest day filter in addition to any filters listed below:
| Tile name | Description | Create the tiles |
|---|---|---|
| Total edits in English | Displays the total number of edits in the English Wikipedia channel for the latest day. | 1. Add the Channel dimension to the filter bar, and select en.wikipedia from the drop-down menu. 2. Click Add to dashboard, and rename the tile. |
| Human edits | Displays the total number of edits made by humans in the latest day. | 1. Add the Is_Robot dimension to the filter bar, and select false from the drop-down menu. 2. Click Add to dashboard, and rename the tile. |
| Language by time | Compares the total number of edits over the latest day per language channel. The x-axis is Time (hour). | 1. Add Channel and Time (hour) to the show bar. 2. In the Channel label, click Sort by (Count) and change the arrow to Descending. 3. Change the visualization type to Heatmap. 4. After you click Add to dashboard, rename the tile. |
| Is robot | Compares the total number of edits made by humans to the edits made by bots in the latest day. | 1. Add the Is_robot dimension to the show bar. 2. Change the visualization type to Sunburst. 3. Click Add to dashboard. Rename the tile. |
| Robot vs People | Compares the total number of edits made by humans to the edits made by bots in the latest day, with nodes for each hour. | 1. Add the Is_robot and Time (hour) dimensions to the show bar. 2. Change the visualization to Area stack. 3. Click Add to dashboard. Rename the tile. |
| Comment length by edits | Shows the comment lengths per page added by a specific user over the latest day. This tile is a revision of the example at the top of this page. | 1. Add the User dimension to the filter bar, and select a specific user. 2. Add the Page dimension to the Show bar. 3. Change the visualization type to Bar chart, and change the Measure to Sum comment length. 4. Click Add to dashboard. Rename the tile. |
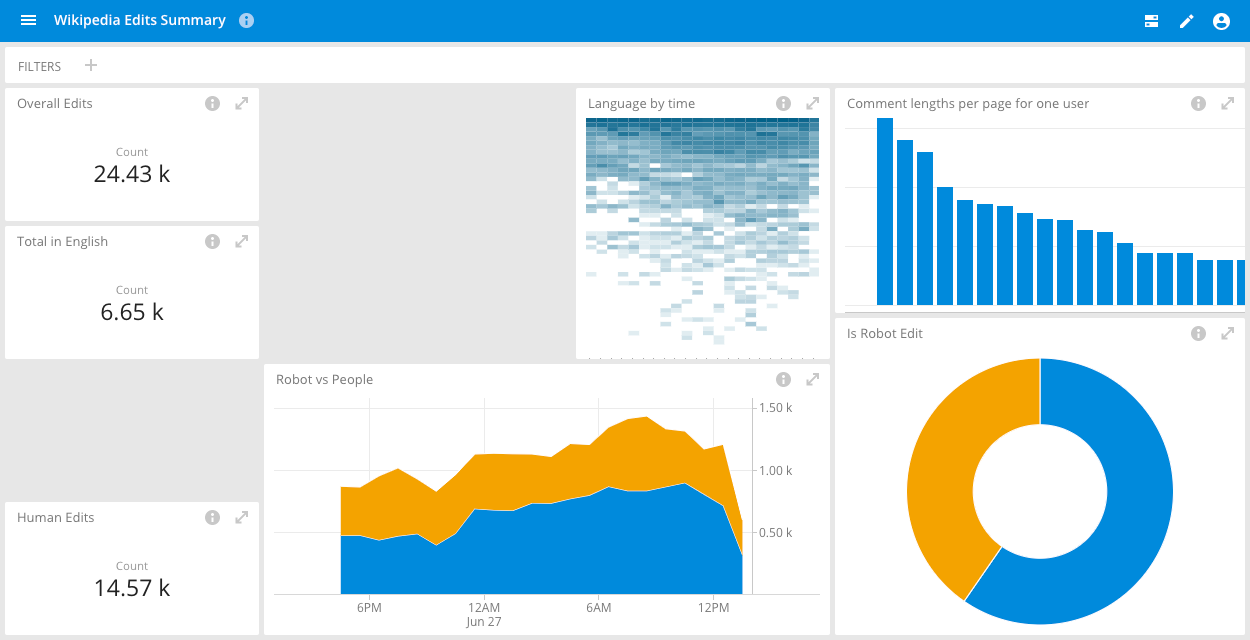
After you have added these six additional tiles to your "Wikipedia Edits Summary" dashboard, you can move and resize the tiles to make them look more like the dashboard example at the top of this page:

Add custom measures
The above example is missing two tiles that require counts of unique users and unique pages, respectively. To create these two tiles, add two custom measures:
- Click the More info icon in the Measure sidebar. Then, click Add measure.
- Type "Unique Users" in the Name field, and click Custom.
- Enter the following Plywood expression in the Formula field:
$main.countDistinct($user). - Click Save.
- Repeat this process to create a custom measure called "Unique Pages" using this Plywood expression in the Formula field:
$main.countDistinct($page).
Now that you have these two measures, you can create the final two tiles in the Wikipedia Edits Summary dashboard:
| Tile name | Description | Create the tiles |
|---|---|---|
| Unique Users | Displays the total number of unique users who made Wikipedia edits in the latest day. | 1. With Latest day in the Filter bar, change Measure to Unique Users. 2. Click Add to dashboard. |
| User by unique pages | Displays the number of unique pages each user has edited. | 1. With Latest day in the Filter bar, add the dimension User to the Show bar. 2. Change the Measure to Unique Pages. 3. Click Add to dashboard. |
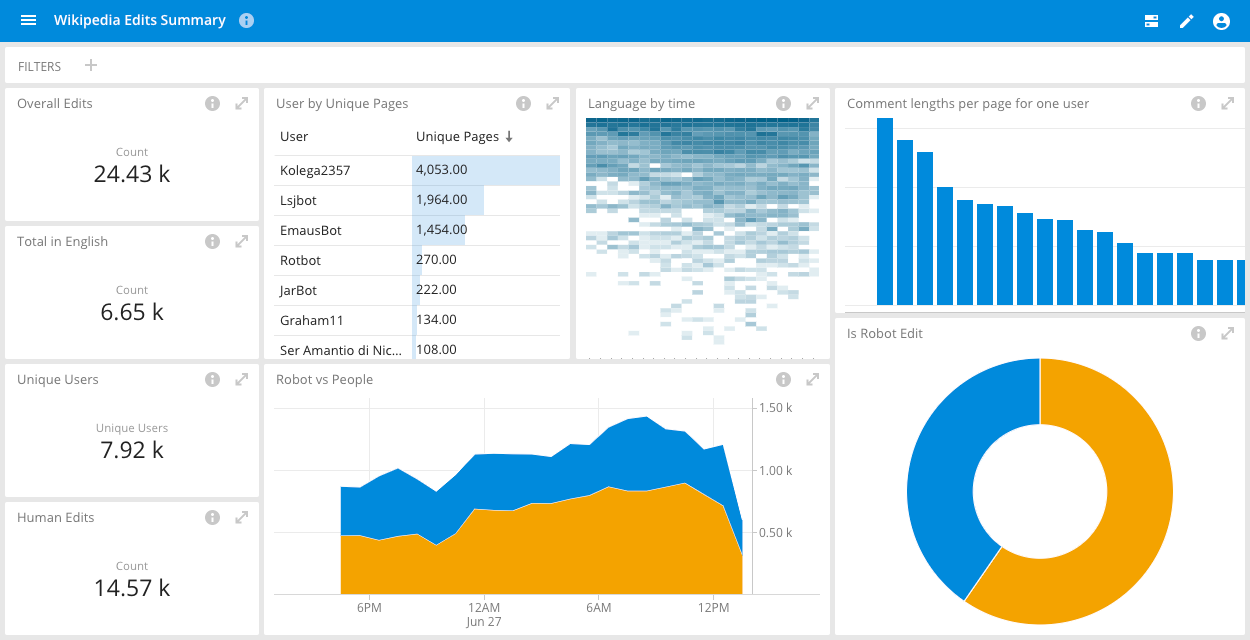
After you have added these two tiles to your Wikipedia Edits Summary dashboard, you can move and resize the tiles to make them look more like the dashboard example at the top of this page:

For additional examples of Plywood expressions you can use to create custom dimensions and measures, see Custom dimensions and measures.
For information on managing dashboards, see Managing dashboards.