Data ingestion tutorial
In this tutorial, you'll build on what you learned in the Imply Quickstart by taking a deeper look at data ingestion. In particular, you'll take a look at these data ingestion features:
- Transforms let you modify column values or generate new computed columns.
- Filters exclude data based on configurable dimension values.
- Rollup lets you aggregate events to achieve greater scalability
In this tutorial, you'll load data by pasting data into the data loader directly. However, the lessons here apply for any datasource type.
This tutorial assumes you have access to a running instance of Imply. If you don't, see the Quickstart for information on getting started.
Step 1: Load sample
-
Open the Druid console as follows:
- In Imply Hybrid (formerly Imply Cloud), Click the Open button from the cluster list or cluster overview page, and then the Load data icon in the Pivot Data page.
- In self-hosted Imply, go to
http://localhost:8888and Start a new spec.
See the Quickstart if you are not familiar with the data loader or do not have Imply.
-
Select Paste Data as the data source type and click Connect data.
-
In the connect page, paste the following content into the data field:
{"timestamp":"2018-01-01T01:01:35Z","srcIP":"1.1.1.1", "dstIP":"2.2.2.2","packets":20,"bytes":9024}
{"timestamp":"2018-01-01T01:01:51Z","srcIP":"1.1.1.1", "dstIP":"2.2.2.2","packets":255,"bytes":21133}
{"timestamp":"2018-01-01T01:01:59Z","srcIP":"1.1.1.1", "dstIP":"2.2.2.2","packets":11,"bytes":5780}
{"timestamp":"2018-01-01T01:02:14Z","srcIP":"1.1.1.1", "dstIP":"2.2.2.2","packets":38,"bytes":6289}
{"timestamp":"2018-01-01T01:02:29Z","srcIP":"3.3.3.3", "dstIP":"2.2.2.2","packets":27,"bytes":1971}
{"timestamp":"2018-01-01T01:05:29Z","srcIP":"1.1.1.1", "dstIP":"2.2.2.2","packets":49,"bytes":10204}
{"timestamp":"2018-01-01T01:07:19Z","srcIP":"3.3.3.3", "dstIP":"2.2.2.2","packets":29,"bytes":1224}
{"timestamp":"2018-01-02T21:33:14Z","srcIP":"7.7.7.7", "dstIP":"8.8.8.8","packets":44,"bytes":6289}
{"timestamp":"2018-01-02T21:33:17Z","srcIP":"7.7.7.7", "dstIP":"8.8.8.8","packets":38,"bytes":3589}
{"timestamp":"2018-01-02T21:33:45Z","srcIP":"7.7.7.7", "dstIP":"8.8.8.8","packets":123,"bytes":93999}
{"timestamp":"2018-01-02T21:35:45Z","srcIP":"7.7.7.7", "dstIP":"8.8.8.8","packets":12,"bytes":2818}
The data represents, roughly, a few network connection events. The data is in JSON format. Druid supports TSV, CSV, and JSON data formats out-of-the-box, as well as other popular data packaging formats such as Avro, Parquet, and Orc.
With
inlineas the Source type, click Apply. This means that the data will be embedded within the ingestion spec; this is not a typical real-world mechanism for loading data, but it is very useful for learning and exploration. -
Click Next: Parse data.
-
Choose
jsonas the Input format and then Apply. -
Click Next: Parse time. Verify that the timestamp values are correctly selected as the
__timecolumn.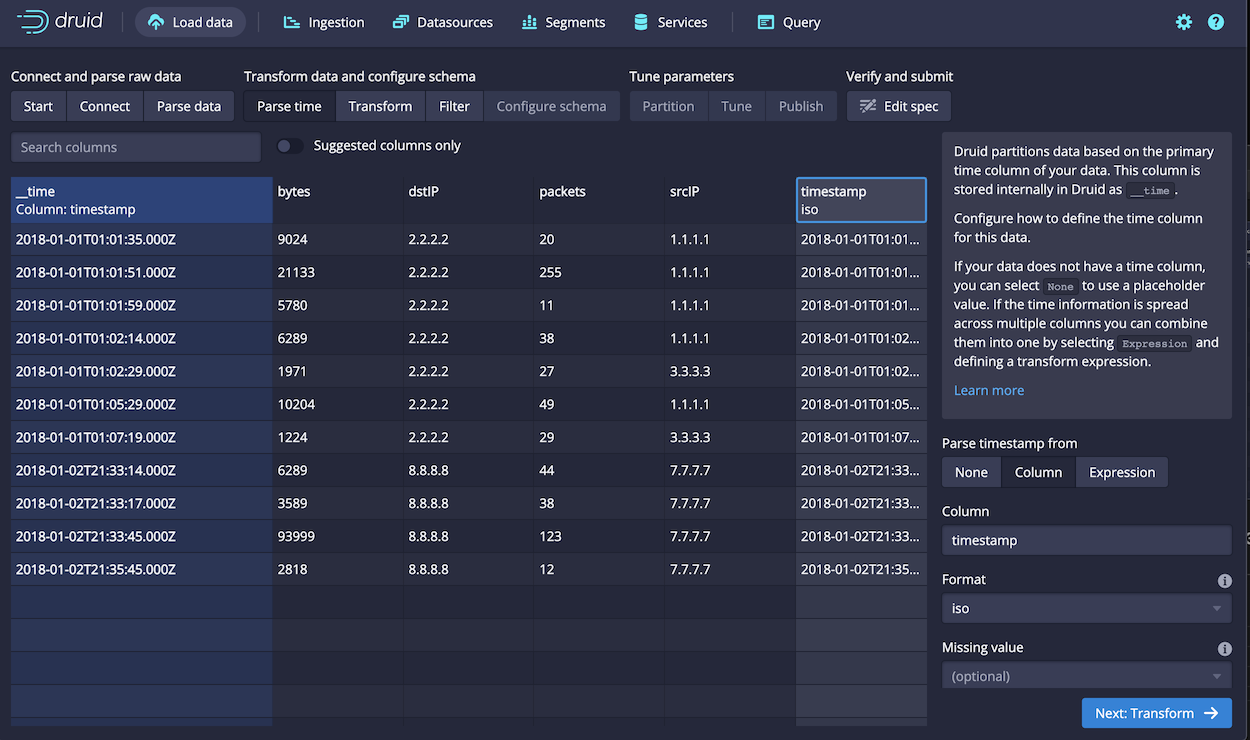
-
Click Next: Transform.
-
Click Add column transform.
A transform lets you manipulate the data to create new computed columns or alter existing columns. For a simple example, create a new column that shows the average bytes per packet as follows:
- In the Name field, enter a name for the new dimension, such as
Bytes per packet. - For type, keep the default,
expression. - As the Expression value, enter
"bytes" / "packets", to divide total bytes by the number of packets. - Click Apply. The new column appears in the data set:
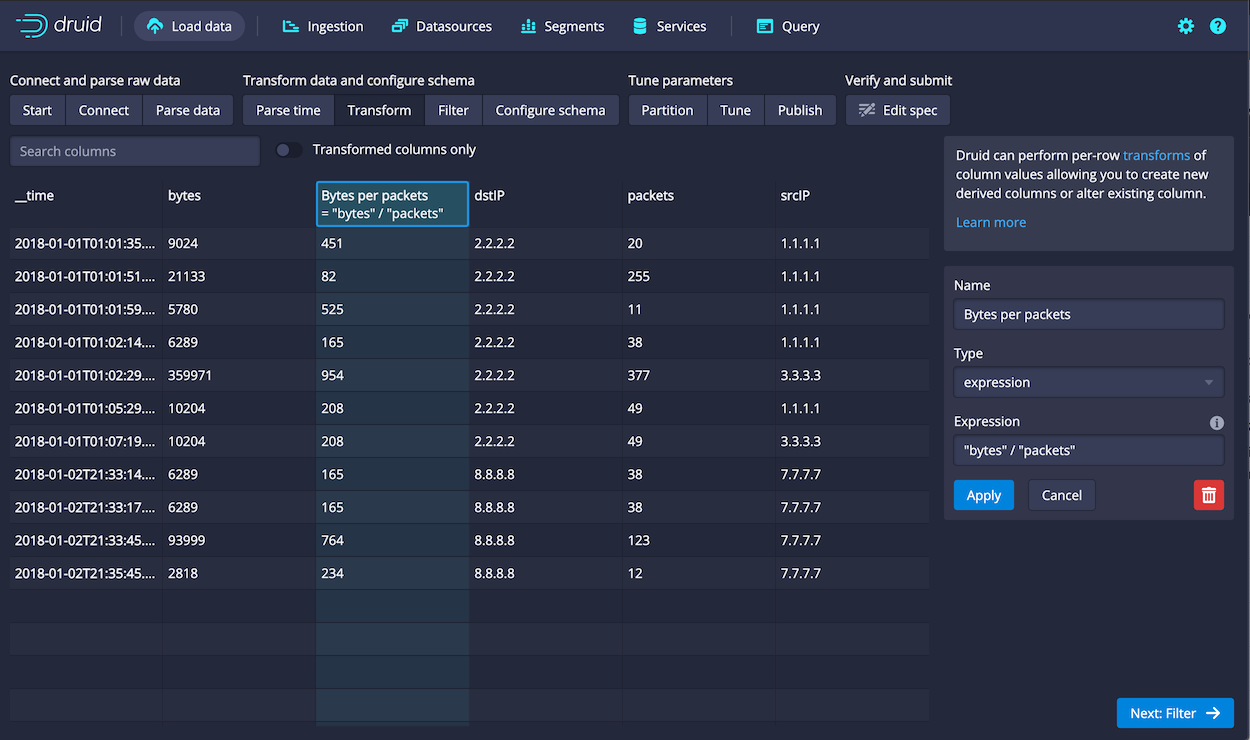
- In the Name field, enter a name for the new dimension, such as
-
Click Next: Filter. In the fictional data set, notice that connections originate from three source IPs. Let's say one is irrelevant to your use case, and can be removed. In a production setup, filtering can help you omit corrupted data or unwanted data in general.
-
Click Add column filter and follow these steps to configure the filter:
-
For the Type, choose
not. -
For the Sub-filter type, choose
selector. -
In the Sub-filter dimension field, enter
srcIP. -
For Sub-filter value, enter
3.3.3.3, as follows: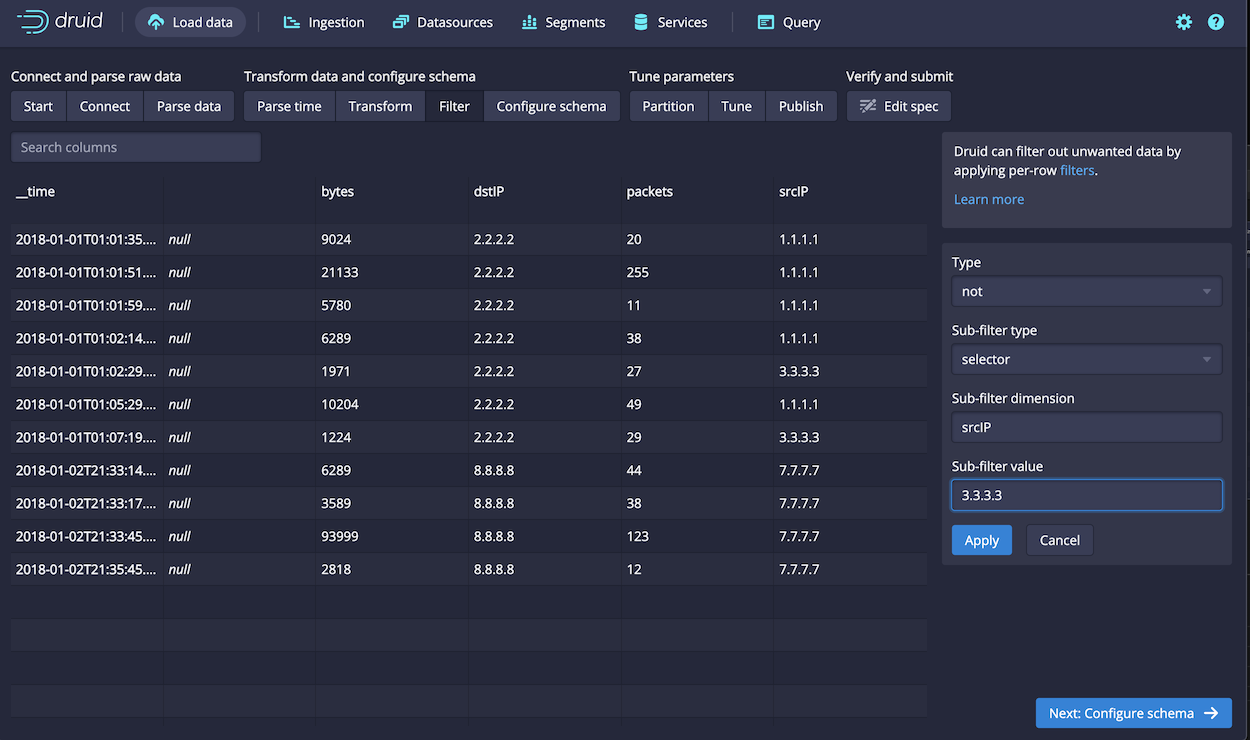
-
Click Apply. The rows with the filtered IP address no longer appear in the sample data. You can edit the filter later by clicking Edit global filter.
-
-
Click Next: Configure schema.
The Configure schema page lets you apply data rollup, which is a form of data aggregation. Next you'll adjust the rollup settings to see the effects in practice.Enable rollup as follows:
- Click the Rollup switch to enable rollup.
- Confirm the operation when prompted by clicking Yes - enable rollup. Notice that the query granularity defaults to hour, which means that the events that occurred in the same hour are aggregated, leaving us just two rows.
- An hourly rollup is too coarse for this data, so choose
minuteas the Query granularity. Now you should have 5 rows, as shown in the following screenshot:
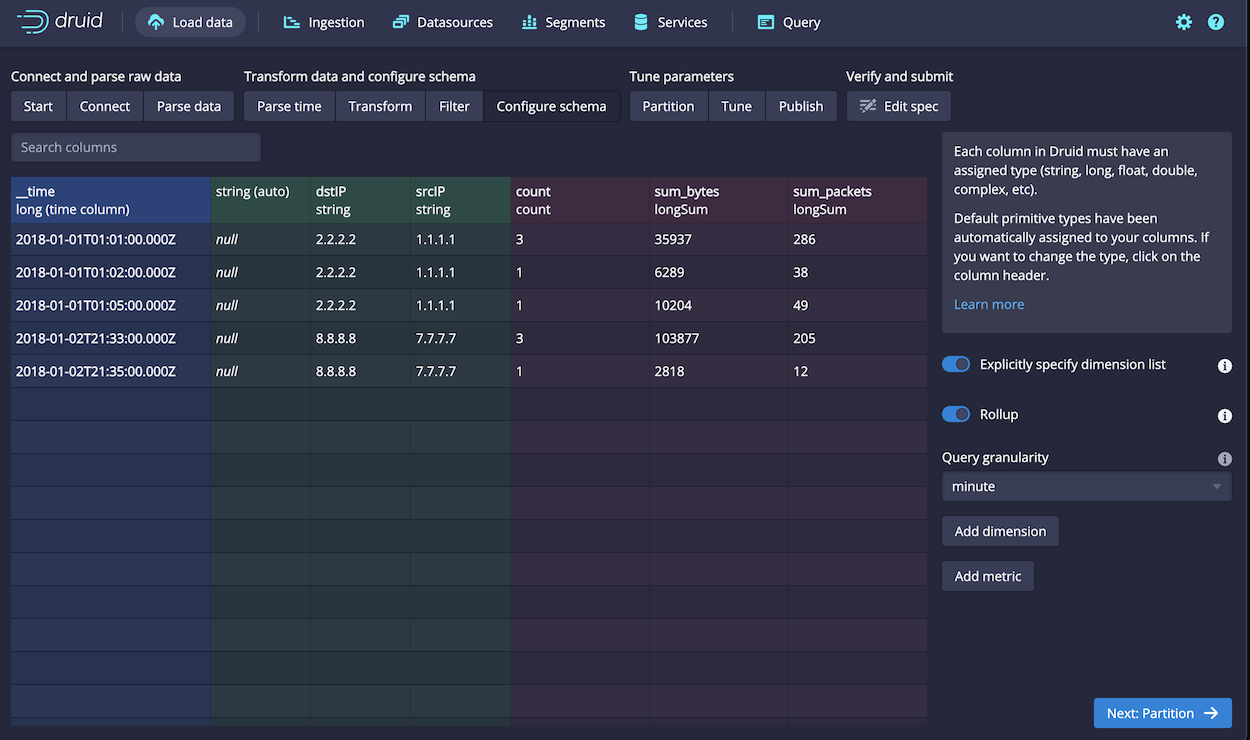
Taking a closer look, recall that we had 11 events in the original data set, two of which were excluded by filter. After rollup, the events that occurred in the same minute are aggregated, with the number of packets and bytes for the aggregated events summed.
That is, the first row in the result set represents the first three rows in the original data:
{"timestamp":"2018-01-01T01:01:35Z","srcIP":"1.1.1.1", "dstIP":"2.2.2.2","packets":20,"bytes":9024}
{"timestamp":"2018-01-01T01:01:51Z","srcIP":"1.1.1.1", "dstIP":"2.2.2.2","packets":255,"bytes":21133}
{"timestamp":"2018-01-01T01:01:59Z","srcIP":"1.1.1.1", "dstIP":"2.2.2.2","packets":11,"bytes":5780}
The timestamp represents the starting point of the timeframe, 2018-01-01T01:01:00.000Z. The bytes and packets are the sum of the three events. Important to note is that while the number of stored rows is reduced by rollup, the event count (9) is not changed for purposes of the data, as you'll see later in Pivot.
While learning or exploring Imply, the results of rollup can be a little confusing: it results in fewer rows in the ingested data source than in the original. However, when dealing with very large data sets where fidelity of individual data points are less relevant than broader trends, rollup is an important aspect of data schema design. See What is rollup? for more information.
-
Click Next: Partition.
-
There are a few settings on the Partition page that need to be set to continue:
- For the Segment granularity, choose
day. The segment granularity determines how segments are partitioned upon ingestion. For large data sets, you want to keep each segment size under a GB for performance reasons. - Choose
dynamicas the Partitioning type for secondary partitioning. - Click Next: Tune.
- For the Segment granularity, choose
-
You can keep the tune and publish settings at their defaults, and click Next: Publish and then Next: Edit spec to continue.
The finished ingestion spec appears in the text field. You can modify it directly or click back to previous setting configuration screens to make changes.
-
When ready click Submit. The new task should appear in the Ingestion page with a status of PENDING.
When the task finishes successfully, Druid proceeds to distribute the data across nodes for serving. This distribution process can take 1 to 2 minutes. Once completed, the new datasource appears in the Datasources list. Notice that there are five rows and two segments for our data source, since we partitioned events that occurred over a two-day time span by day.
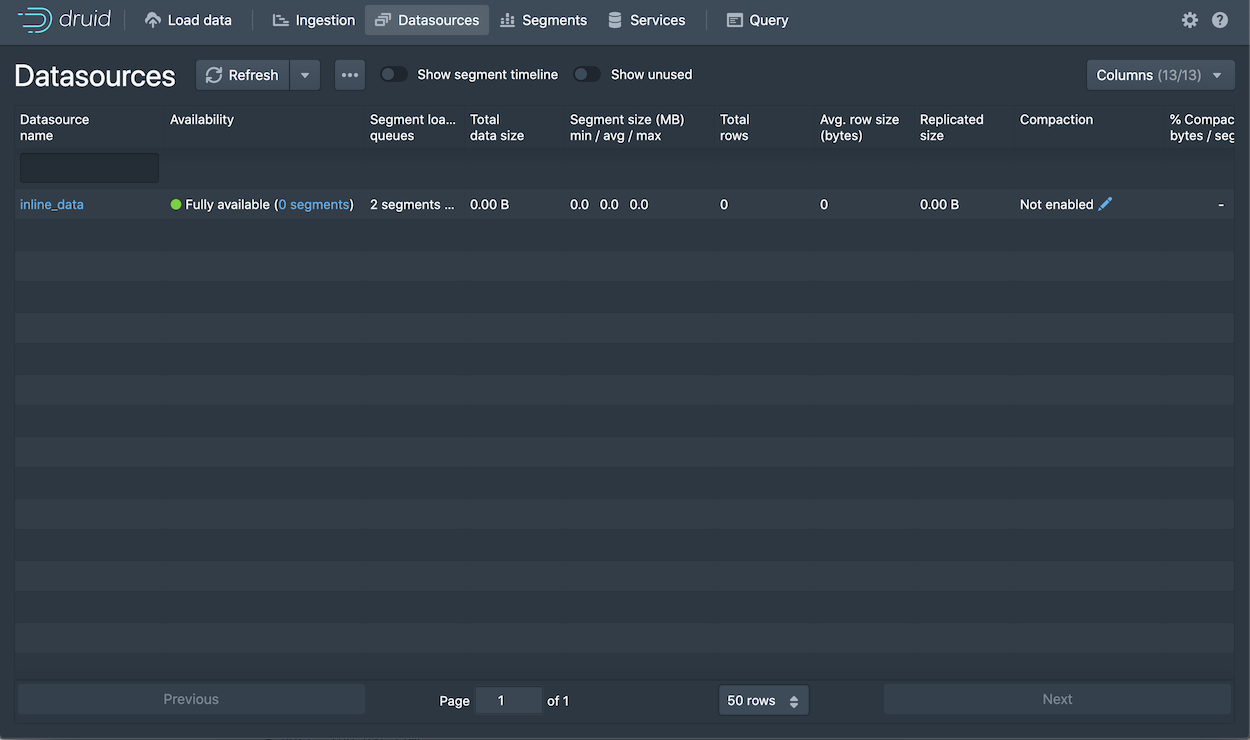
You can now query the data in the Druid console or create a data cube in Pivot, as described next.
Step 2: Build a data cube
Now build a data cube in Pivot based on your new datasource:
-
Navigate to Pivot from the Imply Manager or, if running locally, go directly to http://localhost:9095.
See the Quickstart if you are not familiar with Pivot.
-
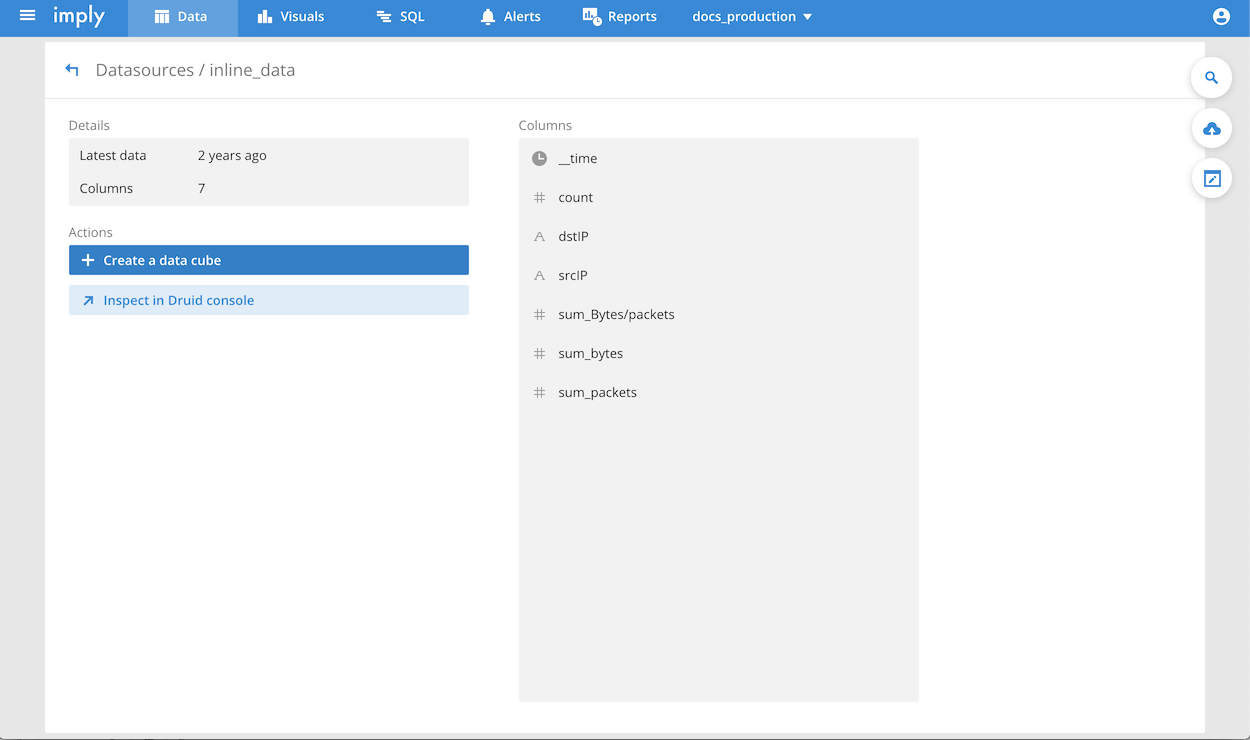
In the Data page, click on the datasource,
inline_data. -
Click Create a data cube:
-
Click Go to data cube.
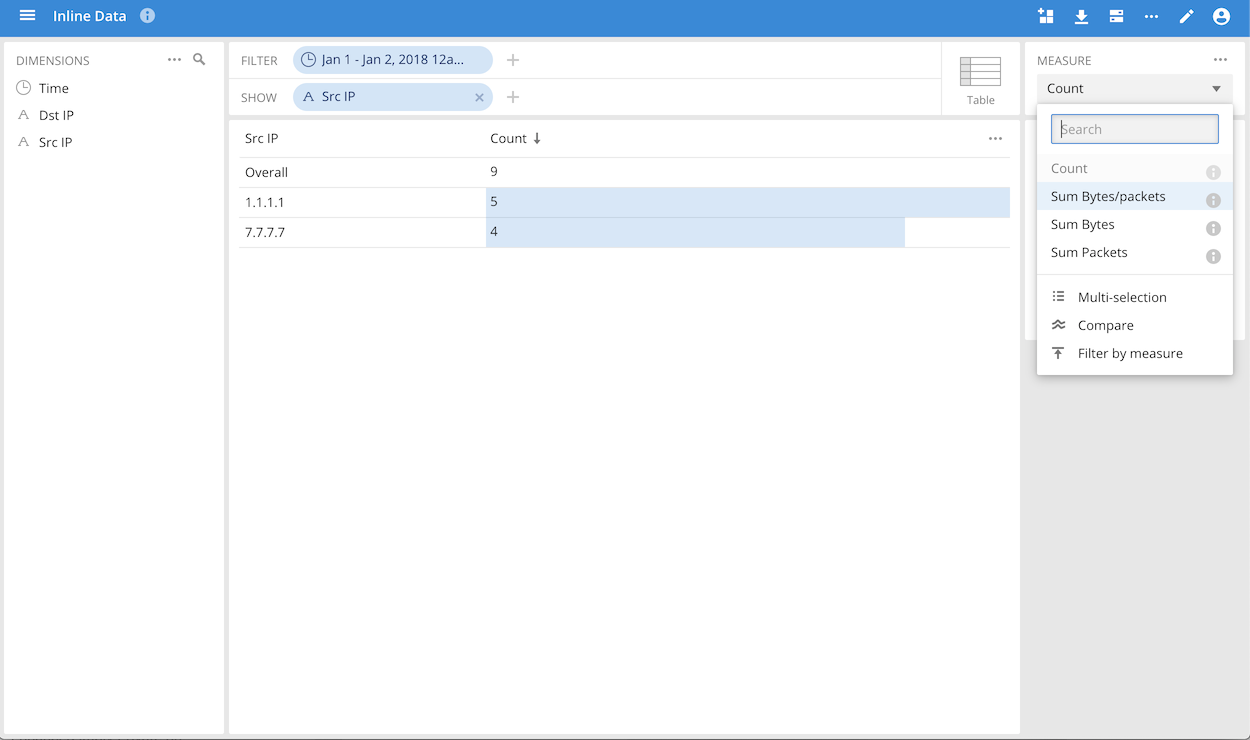
Now you can slice and dice the newly ingested data as you would with any other data cube. Notice that the event count is 9, as previously discussed, and that the computed measure you created, Bytes/packet, appears in the Measure menu:
Step 3: Examine the ingestion spec
At any time, you can see the ingestion spec you created by clicking Open in data loader from the actions menu for the ingestion task:
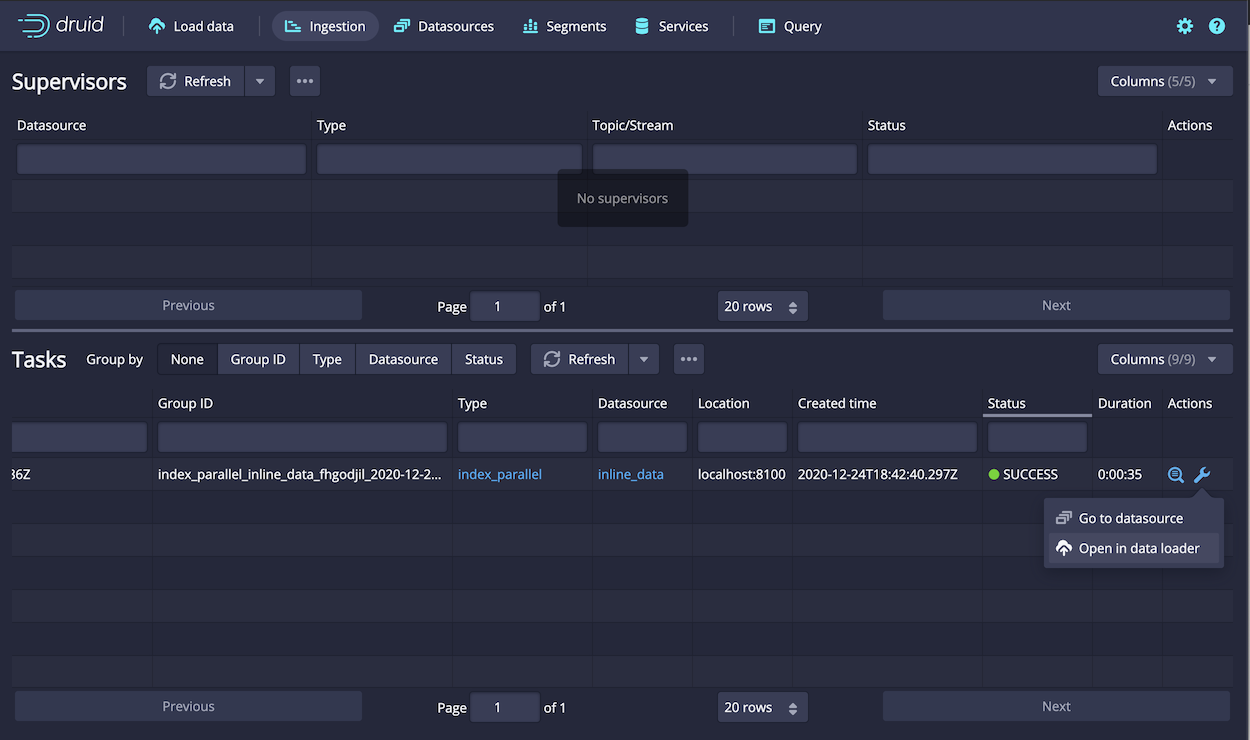
For your reference, the complete ingestion spec you created appears below as well.
Notice the features you added to the spec based on the data loader configuration, in particular the transformSpec, filter, and granularitySpec, which includes the rollup configuration.
Another point to note is that the inputSource encapsulates the mechanism you used to upload the data, in this case, which you did by copying and pasting data into the data loader. You can apply the same spec to other input sources that contain the same data by changing this single element of the spec.
{
  "type": "index_parallel",
  "spec": {
    "ioConfig": {
      "type": "index_parallel",
      "inputSource": {
        "type": "inline",
        "data": "   {\"timestamp\":\"2018-01-01T01:01:35Z\",\"srcIP\":\"1.1.1.1\", \"dstIP\":\"2.2.2.2\",\"packets\":20,\"bytes\":9024}\n   {\"timestamp\":\"2018-01-01T01:01:51Z\",\"srcIP\":\"1.1.1.1\", \"dstIP\":\"2.2.2.2\",\"packets\":255,\"bytes\":21133}\n   {\"timestamp\":\"2018-01-01T01:01:59Z\",\"srcIP\":\"1.1.1.1\", \"dstIP\":\"2.2.2.2\",\"packets\":11,\"bytes\":5780}\n   {\"timestamp\":\"2018-01-01T01:02:14Z\",\"srcIP\":\"1.1.1.1\", \"dstIP\":\"2.2.2.2\",\"packets\":38,\"bytes\":6289}\n   {\"timestamp\":\"2018-01-01T01:02:29Z\",\"srcIP\":\"3.3.3.3\", \"dstIP\":\"2.2.2.2\",\"packets\":27,\"bytes\":1971}\n   {\"timestamp\":\"2018-01-01T01:05:29Z\",\"srcIP\":\"1.1.1.1\", \"dstIP\":\"2.2.2.2\",\"packets\":49,\"bytes\":10204}\n   {\"timestamp\":\"2018-01-01T01:07:19Z\",\"srcIP\":\"3.3.3.3\", \"dstIP\":\"2.2.2.2\",\"packets\":29,\"bytes\":1224}\n   {\"timestamp\":\"2018-01-02T21:33:14Z\",\"srcIP\":\"7.7.7.7\", \"dstIP\":\"8.8.8.8\",\"packets\":44,\"bytes\":6289}\n   {\"timestamp\":\"2018-01-02T21:33:17Z\",\"srcIP\":\"7.7.7.7\", \"dstIP\":\"8.8.8.8\",\"packets\":38,\"bytes\":3589}\n   {\"timestamp\":\"2018-01-02T21:33:45Z\",\"srcIP\":\"7.7.7.7\", \"dstIP\":\"8.8.8.8\",\"packets\":123,\"bytes\":93999}\n   {\"timestamp\":\"2018-01-02T21:35:45Z\",\"srcIP\":\"7.7.7.7\", \"dstIP\":\"8.8.8.8\",\"packets\":12,\"bytes\":2818}"
      },
      "inputFormat": {
        "type": "json"
      }
    },
    "tuningConfig": {
      "type": "index_parallel",
      "partitionsSpec": {
        "type": "dynamic",
        "partitionDimension": ""
      }
    },
    "dataSchema": {
      "dataSource": "inline_data",
      "timestampSpec": {
        "column": "timestamp",
        "format": "iso"
      },
      "transformSpec": {
        "transforms": [
          {
            "type": "expression",
            "name": "",
            "expression": "\"bytes\" / \"packets\""
          }
        ],
        "filter": {
          "type": "not",
          "field": {
            "type": "selector",
            "dimension": "srcIP",
            "value": "3.3.3.3"
          }
        }
      },
      "dimensionsSpec": {
        "dimensions": [
          "",
          "dstIP",
          "srcIP"
        ]
      },
      "granularitySpec": {
        "queryGranularity": "minute",
        "rollup": true,
        "type": "uniform",
        "segmentGranularity": "day"
      },
      "metricsSpec": [
        {
          "name": "count",
          "type": "count"
        },
        {
          "name": "sum_bytes",
          "type": "longSum",
          "fieldName": "bytes"
        },
        {
          "name": "sum_packets",
          "type": "longSum",
          "fieldName": "packets"
        }
      ]
    }
  }
}
Next steps
Congratulations! You have expanded your understanding of the data loader by exploring how to use its ingestion specification features to optimize and adapt ingestion to achieve the best results for your unique data set and use cases.
For more reading, see: