Lumi Enterprise usage metrics
AI summary
About AI summaries.
This information applies to Lumi Enterprise.
Imply provides usage metrics for your Lumi Enterprise deployment to help you make informed decisions about performance, capacity, and scaling. Imply organizes these metrics into intuitive dashboards that you can use to monitor deployment health, identify and troubleshoot performance issues, and plan infrastructure changes.
This topic describes the available usage dashboards for Lumi Enterprise.
Prerequisites
To view usage dashboards, you need a Lumi user with the Admin role. For information on roles and permissions, see Manage roles.
Usage dashboards
To access the dashboards:
- Open the Lumi Management Console.
- Click Usage in the left sidebar.
- Go to the Enterprise tab.
Each dashboard includes:
- A line chart showing how metrics change over time.
- A Current usage section showing metric values as of the displayed timestamp. Metric values update when you refresh the page.
Query vCPU utilization
This dashboard shows how your deployment's query-related vCPU usage changes over time. Each line represents vCPU usage for different node types involved in query processing:
- Data nodes store, manage, and scan data during query execution.
- Broker nodes initiate queries, plan and dispatch subtasks, finalize and stream query results to clients.
- Ingestion nodes index incoming events and process queries against real-time data.
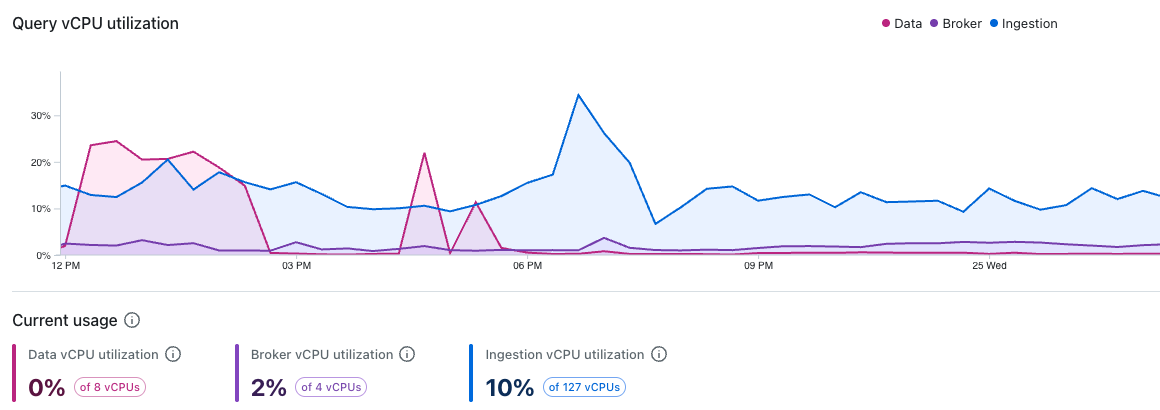
Increases in vCPU usage may be caused by resource-intensive queries, increased query concurrency, or a combination of both. Tracking these metrics helps detect workload spikes and balance the load between nodes.
If vCPU usage remains high during normal operations, consider changing instance type of the affected nodes. Persistent high vCPU usage indicates that your current workload requires action; either adding more vCPUs per host, adding more hosts, or both.
Kafka lag
This dashboard shows Kafka consumer lag for the following topics:
iow_collected: Events collected and parsed by the event collector, before pipeline processing.iow_events: Parsed, primary events waiting to be ingested.iow_events_slow: Parsed, secondary events routed to a slower ingestion lane. This lane typically has fewer resources and higher expected lag.
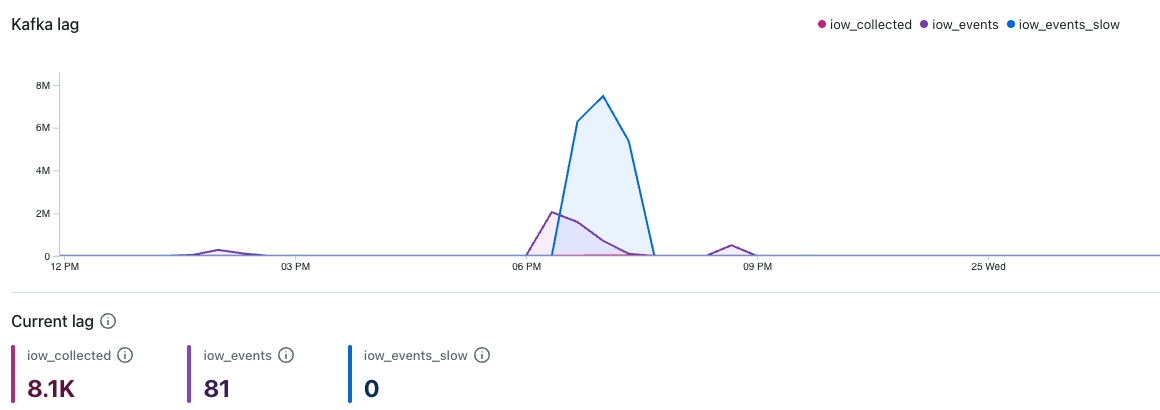
Kafka lag tracks the gap between messages arriving in a Kafka topic and messages being ingested. Increased lag indicates that ingestion can't keep up with the rate of incoming messages.
Lag can be transient, such as when a temporary spike in event volume causes lag to rise before returning to normal. If lag persists during typical event volumes, it may indicate that the ingestion task count is under-provisioned.
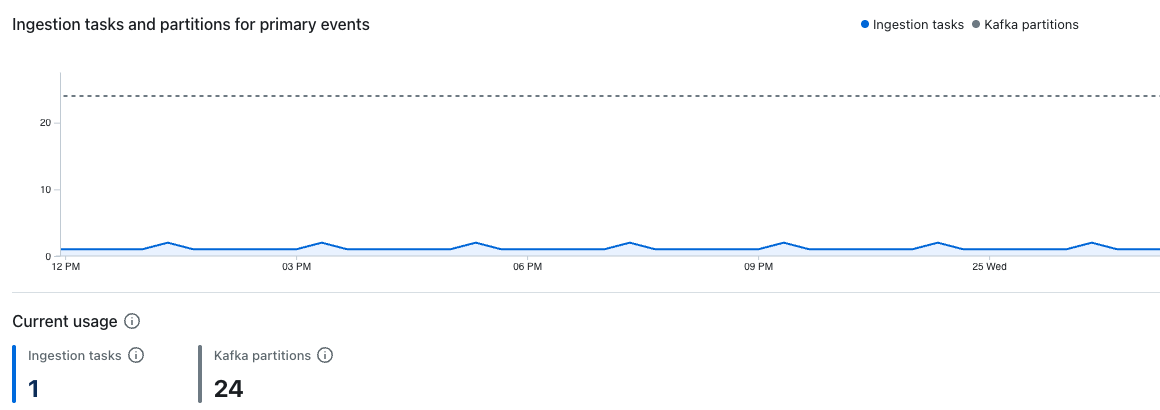
Ingestion tasks and partitions
These dashboards show the number of active ingestion tasks and partitions processing events in the iow_events and iow_events_slow Kafka topics over time.
The dashboard for primary events shows active ingestion tasks and partitions in the iow_events Kafka topic:
The dashboard for secondary events shows active ingestion tasks and partitions in the iow_events_slow Kafka topic:
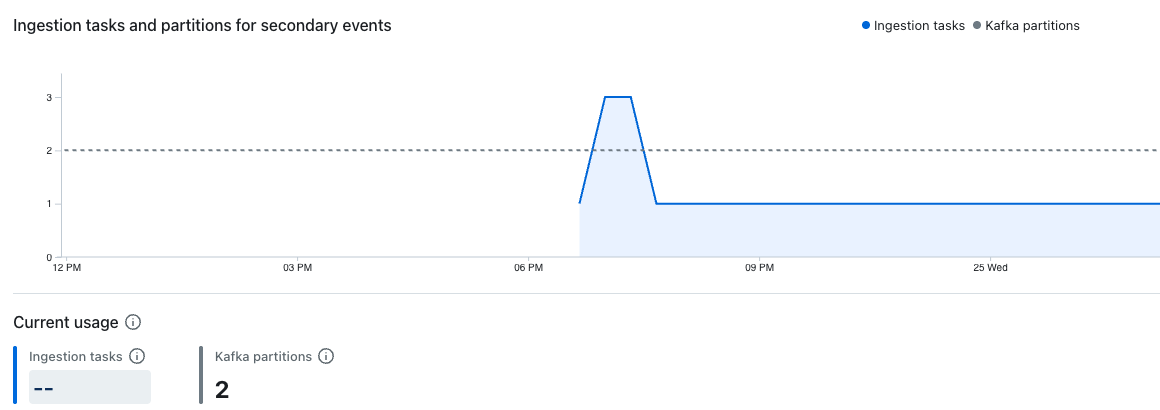
Lumi dynamically assigns Kafka partitions to individual ingestion tasks. Each ingestion task processes one or more Kafka partitions depending on the ratio of tasks to partitions.
Increasing ingestion task count allows Lumi to distribute ingestion work across more tasks, which improves throughput and can reduce any ingestion lag.
If the number of ingestion tasks is equal to the number of Kafka partitions, your ingestion has reached its parallelism limit. At this point, adding more ingestion tasks has no effect. To increase parallelism further, contact Imply support to increase your Kafka partition count.
Event collector vCPU utilization
This dashboard shows the percentage of available vCPUs used by the event collector to process incoming events:
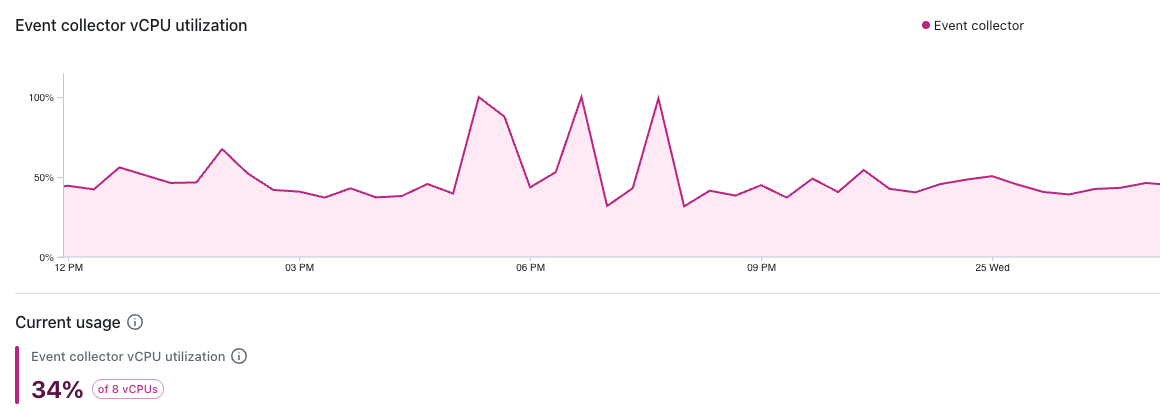
An increase in vCPU utilization indicates that the service is doing more work than before, which could be caused by higher ingestion volumes, increased event complexity, or slower downstream services.
Events
This dashboard shows the number of received and successfully processed events:
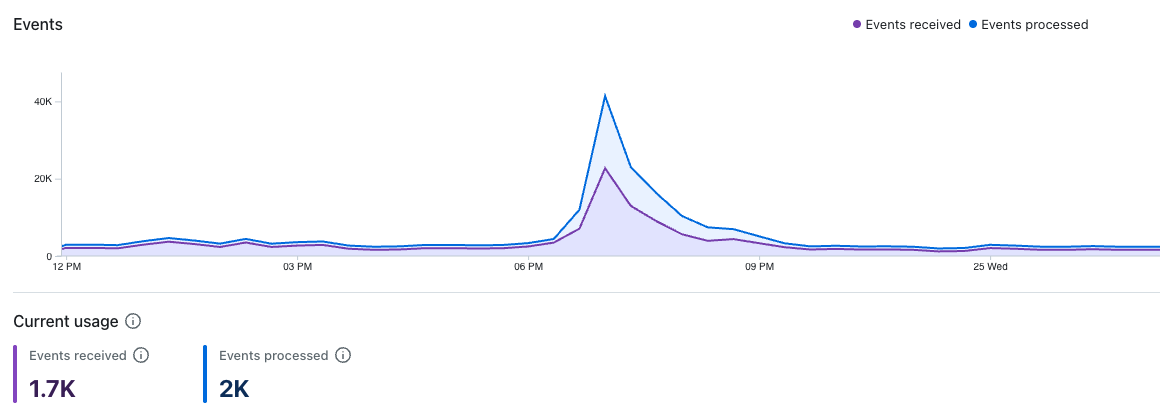
A gap between received and processed events indicates that lag is accumulating.
Learn more
See the following topics for more information:
- Glossary for definitions of Lumi terms.
- Install Lumi Enterprise to deploy Lumi Enterprise using Terraform.
- Send events to Lumi for details on sending events to Lumi.
- Search Lumi events for options to search events in Lumi.