Federated search examples
AI summary
About AI summaries.
This topic provides example federated queries that run against Imply Lumi events from Splunk®.
Each example demonstrates a fully supported SPL command, with output shown where it helps illustrate the result. You can run the queries against the example data for tutorials.
See Federated search reference for a full list of SPL commands, syntax, and functions supported by Lumi for federated searches.
Federated search queries event data only, not system attributes.
About the examples
The examples in this topic use standard mode federated search syntax:
index="federated:lumi_main"
Replace this with your own index specification based on your federated search mode:
- Transparent mode: Use
index=YOUR_LUMI_INDEX_NAME - Standard mode: Use
index="federated:YOUR_FEDERATED_INDEX_NAME"
For more information on standard and transparent modes, see Search events with Splunk.
Basic event searches
Use these commands to filter, sort, and refine search results for Lumi events.
fields
Find all HTTP 400 (Bad Request) events, displaying only the host, source, and method fields in the results:
index="federated:lumi_main" status=400 | fields host, source, method
head
Search for events where method is either GET or POST, and show the five most recent results:
index="federated:lumi_main" method IN (GET, POST) | head 5
rename
Count events by status code and rename the status field to http_status for clearer labeling in the output:
index="federated:lumi_main"
| stats count by status
| rename status AS http_status
replace
Replace common HTTP methods with more readable action labels and show matching events with method, client IP, and URI path.
index="federated:lumi_main"
| replace GET with "Read" POST with "Submit" PUT with "Update" DELETE with "Remove" IN method
| table method clientip uri_path
Example output:
method | clientip | uri_path |
|---|---|---|
Submit | 237.215.7.11 | /cart |
Update | 183.245.119.215 | /categories/smart-lighting/color-changing-bulb |
Read | 117.107.171.174 | /categories/indoor-lighting/aurora-chandelier |
Remove | 140.199.252.124 | /categories/outdoor-lighting/moonlit-garden-lamp |
search
The search keyword is implied at the beginning of a query.
Use search explicitly in nested searches and when filtering later in a query.
Count events by HTTP status, then filter the result to only the 200 and 404 rows:
index="federated:lumi_main"
| stats count by status
| search status=200 OR status=404
Example output:
status | count |
|---|---|
200 | 10 |
400 | 6 |
sort
Retrieve all HTTP 400 (Bad Request) events, show the host, source, and method fields only, and sort the results alphabetically by host:
index="federated:lumi_main"
| status=400
| fields host, source, method
| sort host
tail
Search for all HTTP 400 (Bad Request) events, returning only the last three matching events:
index="federated:lumi_main" status=400 | tail 3
where
Retrieve events where the host is 10.0.1.19 and the status is 200:
index="federated:lumi_main"
| WHERE host = "10.0.1.19" AND status = 200
Filtering and matching
Use these commands to extract, compare, and transform field values for more precise filtering.
eval
Check if the useragent exactly matches Google's bot identifier and count how many events are from bots versus non-bots:
index="federated:lumi_main"
| eval is_bot=if(useragent="Mozilla/5.0 (compatible; Googlebot/2.1; +http://www.google.com/bot.html)", "yes", "no")
| stats count by is_bot
Example output:
is_bot | count |
|---|---|
no | 254 |
yes | 54 |
regex
Show only those events where the uri_path matches a two-level category path under /categories/. Display the user and uri_path.
index="federated:lumi_main"
| regex uri_path="^/categories/[^/]+/[^/]+"
| table user uri_path
Example output:
user | uri_path |
|---|---|
alice997 | /categories/indoor-lighting/eclipse-wall-sconce |
kennethjohnson | /categories/smart-lighting/voice-controlled-bulb |
dorothy3321 | /categories/outdoor-lighting/solar-path-light |
rex
Extract the operating system from the useragent string and display it alongside the user:
index="federated:lumi_main"
| rex field=useragent "\((?<os>[^;]+);"
| table user os useragent
Example output:
user | os | useragent |
|---|---|---|
admin728 | Windows NT 10.0 | Mozilla/5.0 (Windows NT 10.0; Win64; x64)... |
parkeranthony | Linux | Mozilla/5.0 (Linux; Android 5.1.1; Nexus 5)... |
kramercosmo | Macintosh | Mozilla/5.0 (Macintosh; Intel Mac OS X 10_11_6)... |
setfields
Set the host, status, and uri fields to specific values and display the results in a table:
index="federated:lumi_main"
| setfields host="10.0.1.19", status="200", uri="/shipping-policy"
| table host, status, uri, _time
Time and aggregation
Use these commands to group, bucket, and summarize Lumi events over time or by key fields.
bin
Group events into 1-hour time intervals and count how many events occur in each interval:
index="federated:lumi_main"
| bin _time span=1h
| stats count by _time
| sort _time
Example output:
_time | count |
|---|---|
2025-07-15 00:00:00 | 17 |
2025-07-15 01:00:00 | 22 |
2025-07-15 02:00:00 | 9 |
2025-07-15 03:00:00 | 14 |
bucket
Round each event’s timestamp down to the nearest hour (3600 seconds), count how many events occurred in each hour, sort them chronologically, and show the first 4 results:
index="federated:lumi_main"
| bucket _time span=3600
| stats count by _time
| sort _time
| head 4
Example output:
_time | count |
|---|---|
2025-10-17 01:00 | 4 |
2025-10-17 02:00 | 1 |
2025-10-17 03:00 | 5 |
2025-10-17 04:00 | 5 |
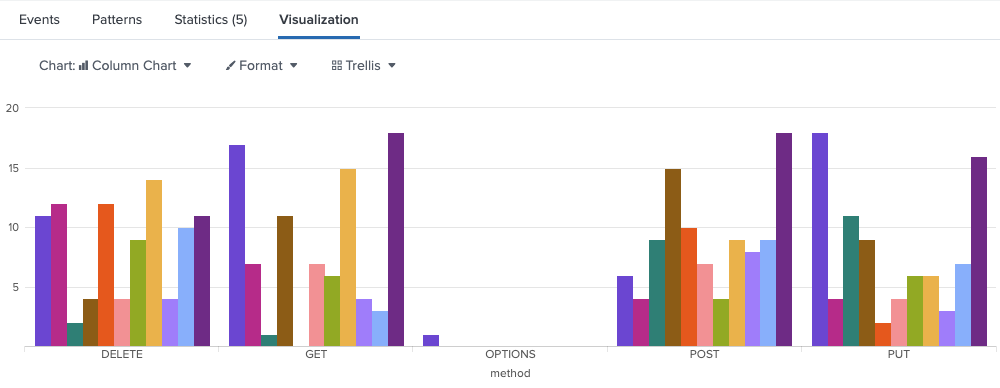
chart
Create a chart showing the request count for each method, broken down by status code over the past 5 days.
index="federated:lumi_main" earliest=-5d@d
| chart count over method by status
Example output:
eventstats
Add a field to every event showing how many events its user has in the result set:
index="federated:lumi_main"
| eventstats count as user_event_count by user
stats
Count the total number of successful requests and the number of unique client IPs:
index="federated:lumi_main" status=200
| stats count AS total_requests, dc(clientip) AS unique_ips
Example output:
total_requests | unique_ips |
|---|---|
171 | 145 |
streamstats
Show a running count of events per user over time, excluding anonymous users, to track how each user’s activity accumulates chronologically:
index="federated:lumi_main"
| where user != "-"
| streamstats count as user_request_count by user
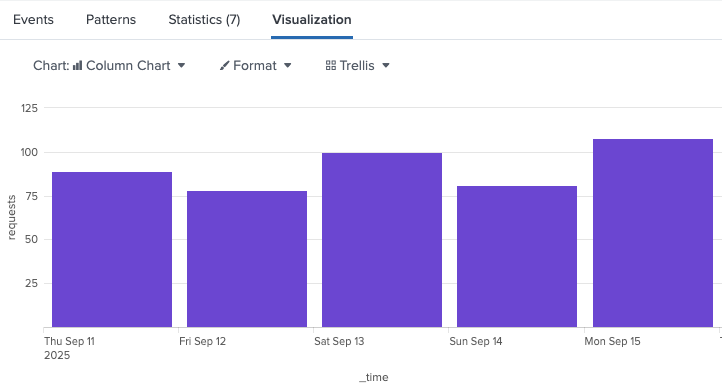
timechart
Create a line chart showing the daily count of events over the past 5 days, with each data point representing a 24-hour period:
index="federated:lumi_main" earliest=-5d@d
| timechart span=24h count as requests
Example output:
tstats
Count the number of events per host using the Web object from the Splunk Web data model:
tstats count AS host_event_count BY host
FROM datamodel=Web.Web
WHERE index="federated:lumi_main"
Example output:
host | host_event_count |
|---|---|
web-01 | 854 |
Text and field extraction
These commands help you extract data from JSON or text fields and format it for analysis.
convert
Convert _time to an ASCII human-readable time and to the number of milliseconds since epoch, and display a table showing the first 5 results:
index="federated:lumi_main"
| convert ctime(_time) AS formatted_time
| convert mstime(_time) AS milliseconds
| table _time user formatted_time milliseconds
| head 5
Example output:
_time | user | formatted_time | milliseconds |
|---|---|---|---|
2025-12-01 00:34:04 | sallyosborne | 12/01/2025 00:34:04 | 1764549244 |
2025-12-01 00:28:25 | trixie9292 | 12/01/2025 00:28:25 | 1764548905 |
2025-12-01 00:13:04 | dorothy3321 | 12/01/2025 00:13:04 | 1764547984 |
2025-12-01 00:00:29 | - | 12/01/2025 00:00:29 | 1764547229 |
2025-11-30 23:46:17 | rhawkins | 11/30/2025 23:46:17 | 1764546377 |
fillnull
Count events grouped by referer and replace any missing referer values with 0:
index="federated:lumi_main"
| fillnull
| stats count by referer
Example output:
referer | count |
|---|---|
https://www.pinterest.com/ | 1 |
https://www.ebay.com/ | 3 |
0 | 5 |
Replace missing referer_domain values with a descriptive placeholder to make null values easier to identify:
index="federated:lumi_main"
| fillnull value="No referer" referer
| table _time user referer
Example output:
_time | user | referer |
|---|---|---|
2025-12-01 00:34:04 | sallyosborne | No referer |
2025-12-01 00:29:29 | trixie9292 | https://techcrunch.com/ |
2025-12-01 00:28:25 | - | https://www.etsy.com/ |
2025-12-01 00:13:04 | dorothy3321 | No referer |
iplocation
Look up the geographic location of each clientip and display the IP with its city, country, region, latitude, and longitude for the last 4 matching events:
index="federated:lumi_main"
| iplocation clientip
| table clientip City Country Region lat lon
| tail 4
Example output:
clientip | City | Country | Region | lat | lon |
|---|---|---|---|---|---|
62.1.162.192 | Athens | Greece | Attica | 37.9838 | 23.7275 |
218.29.115.104 | Zhengzhou | China | Henan | 34.7472 | 113.625 |
192.135.23.153 | Bologna | Italy | Emilia-Romagna | 44.5004 | 11.3568 |
52.79.96.163 | Seoul | South Korea | Seoul | 37.5665 | 126.978 |
lookup
This example requires an existing lookup configuration in Splunk. See Enrich Lumi events with Splunk lookups for setup requirements.
Enrich web traffic events with geographic information from a CSV lookup table, then count requests by country and city.
Note: This example uses transparent mode syntax (no federated: prefix) because lookups only work in transparent mode.
index=main status=200
| lookup geoip clientip OUTPUT country, city
| stats count by country, city

Example output:

| `country` | `city` | `count` |
|--|--|--|
| `United States` | `New York` | `45` |
| `United Kingdom` | `London` | `32` |
| `Canada` | `Toronto` | `18` |
See Enrich Lumi events with Splunk lookups for more information.
mvexpand
Group events by user to collect all URIs they visited, then expand that list so each URI has its own row for further analysis:
index="federated:lumi_main"
| stats values(uri_path) as visited_paths by user
| mvexpand visited_paths
| table user visited_paths
Example output:
user | visited_paths |
|---|---|
admin728 | /admin |
admin728 | /phpinfo.php |
admin728 | /product/orion-pendant-light |
trixie9292 | /admin |
trixie9292 | /cart |
spath
Extract the response_time_ms value from JSON data in the api_response field and put it in a new latency field.
Filter to only show events where latency exceeds 500 milliseconds:
index="federated:lumi_main"
| spath output=latency input=api_response path=response_time_ms
| where latency > 500
Example output:
_time | latency | api_response |
|---|---|---|
2024-09-22 10:15:23 | 750 | {"user":"sallyosborne","status":"success","response_time_ms":750} |
2024-09-22 10:15:24 | 1200 | {"user":"bernd74","status":"error","response_time_ms":1200} |
2024-09-22 10:15:25 | 650 | {"user":"miltonle","status":"success","response_time_ms":650} |
table
Display a table of selected fields for easy viewing and analysis:
index="federated:lumi_main"
| table _time, clientip, status, user
Example output:
_time | clientip | status | user |
|---|---|---|---|
2025-05-13 14:22:21 | 53.3.39.88 | ok | sanderskimberley |
2025-05-13 14:22:36 | 147.197.48.174 145 | ok | kevin10 |
2025-05-13 14:22:58 | 154.24.52.81 145 | ok | cheryl33 |
Data models
Use these commands to query against Splunk data models. The query examples use the CIM Web data model with transparent mode federated search.
datamodel
Return raw Web events from the Web dataset, showing destination, status, source, and URL for each event:
| datamodel Web Web search
| table Web.dest Web.status Web.src Web.url
Example output:
Web.dest | Web.status | Web.src | Web.url |
|---|---|---|---|
web-01 | 403 | 109.98.252.15 | /categories/indoor-lighting/eclipse-wall-sconce |
web-01 | 304 | 244.98.46.91 | /product/eclipse-wall-sconce |
web-01 | 204 | 38.126.89.234 | /checkout |
datamodelsimple
Use this command to explore a data model before writing queries. Return available fields for the Web dataset in the Web data model:
| datamodelsimple type=attributes datamodel=Web nodename=Web.Web
Example output:
attribute | lineage |
|---|---|
category | Web.category |
dest_priority | Web.dest_priority |
url | Web.url |
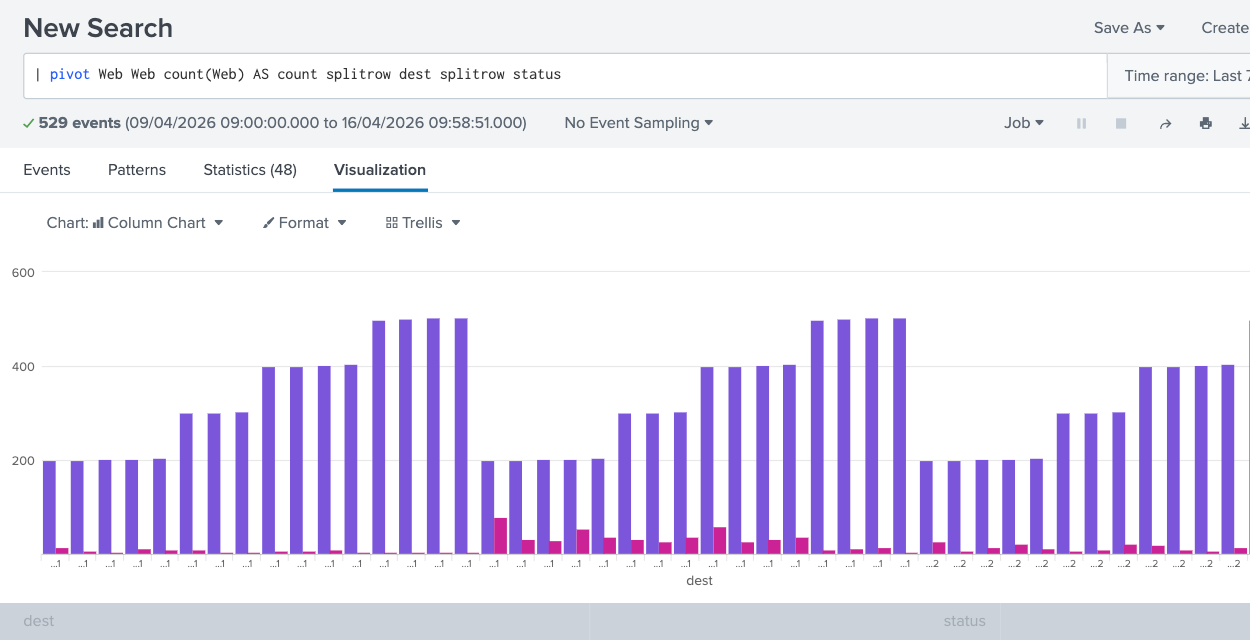
pivot
Generate a count of web events grouped by destination host and HTTP status code:
| pivot Web Web count(Web) AS count splitrow dest splitrow status
Example output:
Error and performance analysis
Use these commands to identify common or rare values, detect anomalies, and analyze performance trends.
rare
Find the two least common combinations of uri and user, excluding events where the user is - and the uri is /:
index="federated:lumi_main"
| where user != "-" AND uri != "/"
| eval combo = uri . " - " . user
| rare limit=2 combo
Example output:
combo | count | percent |
|---|---|---|
/.bash_history - admin374 | 1 | 0.217865 |
/.bash_history - elaine554 | 1 | 0.217865 |
sirare
Find and display statistically rare users among successful requests, excluding anonymous ones:
index="federated:lumi_main"
| where user != "-" AND status=200
| sirare user
| table user
sitop
Identify statistically significant URIs that start with /admin/ and returned a 200 status:
index="federated:lumi_main"
| where status=200 AND match(uri_path, "^/admin/")
| sitop uri_path
top
Show the most common URIs accessed in the index, with how often they appear and their percentage of total events:
index="federated:lumi_main" | top uri
Example output:
uri | count | percent |
|---|---|---|
/home | 524 | 23.4% |
/shipping-policy | 312 | 13.9% |
/contact | 290 | 12.9% |
Learn more
- How to query Lumi using transparent federated search to walk through transparent federated search setup and run example queries.
- How to query Lumi using standard federated search for standard mode setup and examples.
- Federated search reference for supported SPL commands, syntax, and operators in federated search.
- Monitor search performance to use the Splunk job inspector to examine aspects of a search.