Predefined pipelines reference
AI summary
About AI summaries.
Imply Lumi offers predefined pipelines for the log formats described in this topic. A predefined pipeline extracts fields from the raw event message and creates user attributes you can search. Predefined pipelines are enabled by default.
Like other pipelines, the predefined pipeline only operates on incoming events that satisfy the pipeline conditions. If you want to change the conditions or processors, you can use the predefined pipeline as a template for your own custom pipeline. To learn how to use and manage predefined pipelines, see Work with predefined pipelines.
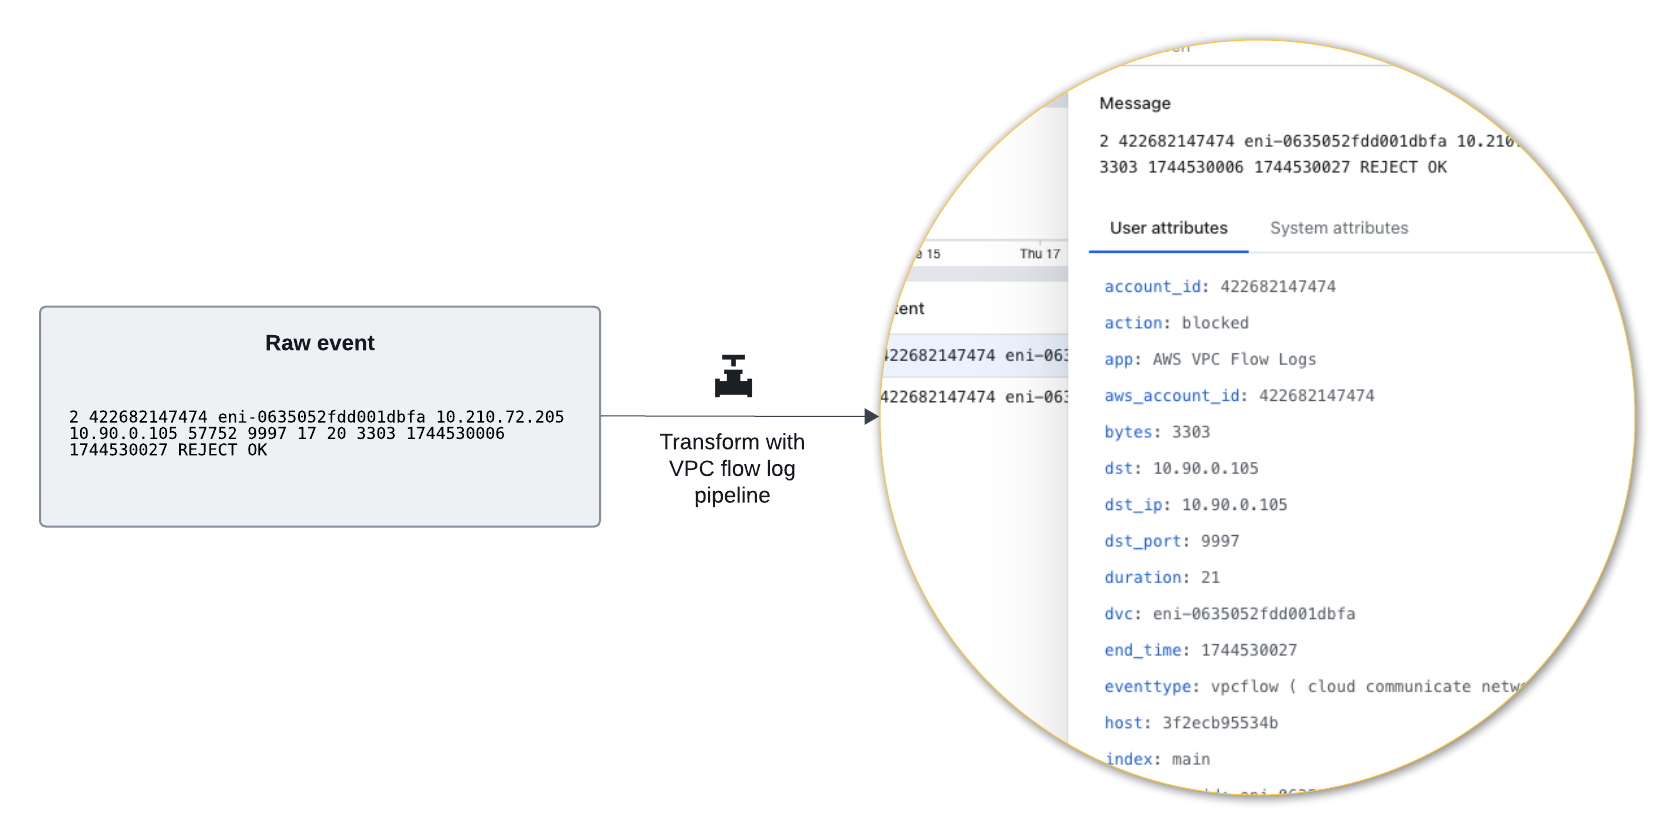
The following diagram shows a raw log event and how its fields appear in Lumi after processing by the predefined pipeline:
AWS CloudTrail logs
Pipeline conditions: sourcetype=aws:cloudtrail
AWS CloudTrail events record actions taken in AWS accounts, including management, data, network activity, and insights events. See the AWS documentation for example events.
This predefined pipeline provides parity with the Splunk® Add-on for Amazon Web Services (AWS).
Example of extracted user attributes
{
  "app": "AwsCloudTrailInsight",
  "awsRegion": "us-east-1",
  "errorCode": "success",
  "eventCategory": "Insight",
  "eventID": "258de2fb-e2a9-4fb5-aeb2-EXAMPLE449a4",
  "eventTime": "2026-04-29T00:22:00Z",
  "eventType": "AwsCloudTrailInsight",
  "eventVersion": "1.08",
  "filename": "s3://example-backfill/260427_cloudtrail-predefined/cloudtrail2_260429.json",
  "index": "main",
  "insightDetails": "{state=End, eventSource=ssm.amazonaws.com, eventName=UpdateInstanceInformation, insightType=ApiCallRateInsight, insightContext={statistics={baseline={average=74.156423842}, insight={average=657}, insightDuration=1}}}",
  "insightDetails.eventName": "UpdateInstanceInformation",
  "insightDetails.eventSource": "ssm.amazonaws.com",
  "insightDetails.insightContext.statistics.baseline.average": "74.156423842",
  "insightDetails.insightContext.statistics.insight.average": "657",
  "insightDetails.insightContext.statistics.insightDuration": "1",
  "insightDetails.insightType": "ApiCallRateInsight",
  "insightDetails.state": "End",
  "msg": "success",
  "product": "CloudTrail",
  "recipientAccountId": "123456789012",
  "region": "us-east-1",
  "sharedEventID": "8b74a7bc-d5d3-4d19-9d60-EXAMPLE08b51",
  "sourcetype": "aws:cloudtrail",
  "start_time": "2026-04-29T00:22:00Z",
  "vendor": "Amazon Web Services",
  "vendor_account": "123456789012",
  "vendor_product": "AWS CloudTrail",
  "vendor_region": "us-east-1"
}
AWS VPC flow logs
Pipeline condition: sourcetype=aws:cloudwatchlogs:vpcflow
Amazon VPC flow logs are a feature of AWS Virtual Private Cloud (VPC) that capture metadata about the IP traffic going to and from network interfaces in your VPC. Extracted user attributes in Lumi include source and destination IP addresses, ports, protocol, and action. See the AWS documentation for example events.
This predefined pipeline provides parity with the Splunk Add-on for Amazon Web Services (AWS).
Example of extracted user attributes
{
  "message": "2 422682147474 eni-0635052fdd001dbfa 198.51.100.205 192.0.2.105 57752 9997 17 20 3303 1756736406 1756736427 REJECT OK",
  "account_id": "422682147474",
  "action": "blocked",
  "app": "AWS VPC Flow Logs",
  "aws_account_id": "422682147474",
  "bytes": 3303,
  "dst": "192.0.2.105",
  "dst_ip": "192.0.2.105",
  "dst_port": 9997,
  "duration": 21,
  "dvc": "eni-0635052fdd001dbfa",
  "end_time": 1756736427,
  "eventtype": "vpcflow ( cloud communicate network )",
  "host": "web-01",
  "index": "main",
  "interface_id": "eni-0635052fdd001dbfa",
  "log_status": "OK",
  "packets": 20,
  "protocol": "ip",
  "protocol_code": 17,
  "protocol_full_name": "User Datagram",
  "protocol_version": "IPV4",
  "source": "vpc-example.log",
  "sourcetype": "aws:cloudwatchlogs:vpcflow",
  "src": "198.51.100.205",
  "src_ip": "198.51.100.205",
  "src_port": 57752,
  "start_time": 1756736406,
  "transport": "udp",
  "user_id": "422682147474",
  "vendor_account": "422682147474",
  "vendor_product": "AWS VPC Flow Logs",
  "version": 2,
  "vpcflow_action": "REJECT",
  "eventId": "e_h5cc5116a-1757079660000-11-952-709-2",
  "receiver": "splunk.s3",
  "team": "Unassigned",
  "env": "Unknown",
  "iamKeyId": "75700224-47b0-498a-b76e-4f0aab3a73e7",
  "processor": "ec 20250905.1661.0",
  "collector": "ec 20250905.1661.0"
}
CrowdStrike FDR logs
Pipeline condition: sourcetype="crowdstrike:*"
CrowdStrike Falcon® is an endpoint security platform that generates logs for endpoint telemetry, detections, and Falcon sensor alerts. The Falcon Data Replicator (FDR) collects, enriches, and replicates the logs for use in observability workflows.
This predefined pipeline provides parity with the Splunk Add-on for CrowdStrike FDR.
Example event
Incoming log:
{
  "ThreadStartAddress": "2674959515648",
  "InjecteeImageFileName": "\\Device\\HarddiskVolume4\\Users\\jdoe\\.vscode\\extensions\\redhat.java-1.54.0-win32-x64\\jre\\21.0.10-win32-x86_64\\bin\\java.exe",
  "ModuleName": "",
  "aip": "203.0.113.45",
  "InjectorImageFileName": "\\Device\\HarddiskVolume4\\Users\\jdoe\\.vscode\\extensions\\redhat.java-1.54.0-win32-x64\\jre\\21.0.10-win32-x86_64\\bin\\jcmd.exe",
  "PayloadClassification": "0",
  "PayloadClassificationFlags": "0",
  "event_platform": "Win",
  "PatternId": "402",
  "EventOrigin": "1",
  "MemoryDescriptionFlags": "1040",
  "id": "00000000-0000-0000-0000-000000000001",
  "EffectiveTransmissionClass": "3",
  "timestamp": "1781046435392",
  "LocalAddressIP4": "10.0.0.100",
  "event_simpleName": "ProcessInjection",
  "TargetThreadId": "123015791627039",
  "ExecutableBytes": "<REDACTED>",
  "ConfigStateHash": "1225469899",
  "ContextProcessId": "6284679965759",
  "WellKnownTargetFunction": "0",
  "ThreadExecutionControlType": "0",
  "ConfigBuild": "1007.3.0021003.15",
  "TargetProcessId": "6237679029452",
  "Entitlements": "15",
  "name": "ProcessInjectionV9",
  "ComputerName": "CL-ANON-0001",
  "aid": "xxxxxxxxxxxxxxxxxxxxxxxxxxxxxxxx",
  "cid": "yyyyyyyyyyyyyyyyyyyyyyyyyyyyyyyy"
}
Lumi user attributes:
{
    "event_platform": "Win",
    "timestamp": "1781046435392",
    "TargetProcessId": "6237679029452",
    "event_simpleName": "ProcessInjection",
    "PayloadClassificationFlags": "0",
    "TargetThreadId": "123015791627039",
    "WellKnownTargetFunction_meaning": "UNKNOWN",
    "PayloadClassification": "0",
    "ComputerName": "CL-ANON-0001",
    "ThreadExecutionControlType": "0",
    "WellKnownTargetFunction": "0",
    "EffectiveTransmissionClass": "3",
    "sourcetype": "crowdstrike:events:sensor",
    "PayloadClassification_meaning": "UNKNOWN",
    "ContextProcessId": "6284679965759",
    "PayloadClassificationFlags_meaning": "NONE",
    "cid": "yyyyyyyyyyyyyyyyyyyyyyyyyyyyyyyy",
    "LocalAddressIP4": "10.0.0.100",
    "EventOrigin": "1",
    "id": "00000000-0000-0000-0000-000000000001",
    "vendor_product": "CrowdStrike FDR",
    "ThreadExecutionControlType_meaning": "THREAD_INJECT",
    "name": "ProcessInjectionV9",
    "ConfigStateHash": "1225469899",
    "ThreadStartAddress": "2674959515648",
    "InjecteeImageFileName": "\\Device\\HarddiskVolume4\\Users\\jdoe\\.vscode\\extensions\\redhat.java-1.54.0-win32-x64\\jre\\21.0.10-win32-x86_64\\bin\\java.exe",
    "MemoryDescriptionFlags": "1040",
    "aip": "203.0.113.45",
    "InjectorImageFileName": "\\Device\\HarddiskVolume4\\Users\\jdoe\\.vscode\\extensions\\redhat.java-1.54.0-win32-x64\\jre\\21.0.10-win32-x86_64\\bin\\jcmd.exe",
    "aid": "xxxxxxxxxxxxxxxxxxxxxxxxxxxxxxxx",
    "ExecutableBytes": "<REDACTED>",
    "PatternId": "402",
    "Entitlements": "15",
    "ModuleName": "",
    "ConfigBuild": "1007.3.0021003.15"
}
FortiGate event logs
Pipeline condition: sourcetype="fgt_event"
FortiGate event logs records system and administrative events, including admin logins, reboots, or VPN status. See the FortiGate documentation for example events.
This predefined pipeline provides parity with the Fortinet FortiGate Add-On for Splunk.
Example of extracted user attributes
{
  "action": "success",
  "body": "Administrator admin logged in successfully from ssh(203.0.113.254)",
  "change_type": "auth",
  "date": "2026-02-17",
  "dest": "203.0.113.2",
  "dest_ip": "203.0.113.2",
  "dstip": "203.0.113.2",
  "eventtime": "1557771654587081441",
  "eventtype": "ftnt_fortigate",
  "id": "0100032001",
  "index": "docs-fortigate",
  "level": "information",
  "log_action": "login",
  "logdesc": "Admin login successful",
  "logid": "0100032001",
  "method": "ssh",
  "msg": "Administrator admin logged in successfully from ssh(203.0.113.254)",
  "product": "Firewall",
  "product_version": "50",
  "profile": "super_admin",
  "reason": "none",
  "result": "Admin login successful",
  "severity": "informational",
  "severity_id": "6",
  "sn": "1557771654",
  "source": "http:docs-fortigate",
  "sourcetype": "fortigate_event",
  "src": "203.0.113.254",
  "src_ip": "203.0.113.254",
  "src_ip_from_ui": "203.0.113.254",
  "src_user": "admin",
  "src_user_name": "admin",
  "src_user_type": "Admin",
  "srcip": "203.0.113.254",
  "status": "success",
  "subtype": "system",
  "time": "11:20:54",
  "type": "event",
  "ui": "ssh(203.0.113.254)",
  "user": "admin",
  "user_name": "admin",
  "user_type": "Admin",
  "vd": "vdom1",
  "vendor": "Fortinet",
  "vendor_action": "login",
  "vendor_product": "Fortinet Firewall",
  "vendor_status": "success"
}
FortiGate traffic logs
Pipeline condition: sourcetype="fgt_traffic" OR sourcetype="fortigate_traffic"
FortiGate traffic logs records traffic flow information for the traffic that passes through FortiGate to your network. See the FortiGate documentation for example events.
This predefined pipeline provides parity with the Fortinet FortiGate Add-On for Splunk.
Example of extracted user attributes
{
 "action": "allowed",
 "app": "HTTP.BROWSER_Firefox",
 "appcat": "Web.Client",
 "appid": "34050",
 "applist": "g-default",
 "apprisk": "elevated",
 "bytes": "2412",
 "bytes_in": "1224",
 "bytes_out": "1188",
 "countapp": "1",
 "date": "2026-02-18",
 "dest": "192.0.2.35",
 "dest_interface": "port11",
 "dest_ip": "192.0.2.35",
 "dest_port": "80",
 "dest_zone": "undefined",
 "dstcountry": "Canada",
 "dstintf": "port11",
 "dstintfrole": "undefined",
 "dstip": "192.0.2.35",
 "dstport": "80",
 "dstuuid": "ae28f494-5735-51e9-f247-d1d2ce663f4b",
 "duration": "116",
 "eventtime": "1557513467369913239",
 "eventtype": "ftnt_fortigate",
 "ftnt_action": "allow",
 "index": "docs-fortigate",
 "level": "notice",
 "logid": "0000000013",
 "mastersrcmac": "a2:e9:00:ec:40:01",
 "osname": "Ubuntu",
 "packets": "33",
 "packets_in": "16",
 "packets_out": "17",
 "policyid": "1",
 "policytype": "policy",
 "poluuid": "ccb269e0-5735-51e9-a218-a397dd08b7eb",
 "product": "Firewall",
 "product_version": "50",
 "proto": "6",
 "protocol": "ip",
 "protocol_version": "ipv4",
 "rcvdbyte": "1224",
 "rcvdpkt": "16",
 "rule": "ccb269e0-5735-51e9-a218-a397dd08b7eb",
 "rule_id": "1",
 "sentbyte": "1188",
 "sentpkt": "17",
 "service": "HTTP",
 "session_id": "105048",
 "sessionid": "105048",
 "source": "http:docs-fortigate",
 "sourcetype": "fortigate_traffic",
 "src": "198.51.100.11",
 "src_interface": "port12",
 "src_ip": "198.51.100.11",
 "src_mac": "a2:e9:00:ec:40:01",
 "src_port": "58012",
 "src_translated_ip": "203.0.113.2",
 "src_translated_port": "58012",
 "src_zone": "undefined",
 "srccountry": "Reserved",
 "srcintf": "port12",
 "srcintfrole": "undefined",
 "srcip": "198.51.100.11",
 "srcmac": "a2:e9:00:ec:40:01",
 "srcport": "58012",
 "srcserver": "0",
 "srcuuid": "ae28f494-5735-51e9-f247-d1d2ce663f4b",
 "subtype": "forward",
 "time": "11:37:47",
 "trandisp": "snat",
 "transip": "203.0.113.2",
 "transport": "tcp",
 "type": "traffic",
 "utmaction": "allow",
 "utmref": "65500-742",
 "vd": "vdom1",
 "vendor": "Fortinet",
 "vendor_action": "close",
 "vendor_product": "Fortinet Firewall",
 "vendor_transport": "58012"
}
FortiGate UTM logs
Pipeline condition: sourcetype="fgt_utm" OR sourcetype="fortigate_utm"
FortiGate UTM logs records security information from Unified Threat Management (UTM) events. See the FortiGate documentation for example events.
This predefined pipeline provides parity with the Fortinet FortiGate Add-On for Splunk.
Example of extracted user attributes
{
  "action": "blocked",
  "agent": "curl/7.47.0",
  "analyticscksum": "275a021bbfb6489e54d471899f7db9d1663fc695ec2fe2a2c4538aabf651fd0f",
  "analyticssubmit": "false",
  "app": "HTTP",
  "category": "EICAR_TEST_FILE",
  "craction": "2",
  "crlevel": "critical",
  "crscore": "50",
  "date": "2026-02-18",
  "dest": "203.0.113.55",
  "dest_interface": "port11",
  "dest_ip": "203.0.113.55",
  "dest_port": "80",
  "dest_zone": "undefined",
  "direction": "incoming",
  "dstintf": "port11",
  "dstintfrole": "undefined",
  "dstip": "203.0.113.55",
  "dstport": "80",
  "dtype": "Virus",
  "eventtime": "1557773103767393505",
  "eventtype": "infected",
  "file_hash": "275a021bbfb6489e54d471899f7db9d1663fc695ec2fe2a2c4538aabf651fd0f",
  "file_name": "eicar.com",
  "file_path": "http://203.0.113.55/virus/eicar.com",
  "filename": "eicar.com",
  "ftnt_action": "blocked",
  "http_user_agent": "curl/7.47.0",
  "ids_type": "network",
  "index": "docs-fortigate",
  "level": "warning",
  "logid": "0211008192",
  "msg": "File is infected.",
  "policyid": "4",
  "product": "Firewall",
  "product_version": "50",
  "profile": "g-default",
  "proto": "6",
  "protocol": "ip",
  "protocol_version": "ipv4",
  "quarskip": "File-was-not-quarantined.",
  "ref": "http://www.fortinet.com/ve?vn=EICAR_TEST_FILE",
  "rule_id": "4",
  "service": "HTTP",
  "session_id": "359260",
  "sessionid": "359260",
  "severity": "critical",
  "signature": "EICAR_TEST_FILE",
  "source": "http:docs-fortigate",
  "sourcetype": "fortigate_utm",
  "src": "192.0.2.11",
  "src_interface": "port12",
  "src_ip": "192.0.2.11",
  "src_port": "60446",
  "src_zone": "undefined",
  "srcintf": "port12",
  "srcintfrole": "undefined",
  "srcip": "192.0.2.11",
  "srcport": "60446",
  "subtype": "virus",
  "time": "11:45:03",
  "transport": "tcp",
  "type": "utm",
  "url": "http://203.0.113.55/virus/eicar.com",
  "vd": "vdom1",
  "vendor": "Fortinet",
  "vendor_action": "blocked",
  "vendor_eventtype": "infected",
  "vendor_product": "Fortinet Firewall",
  "vendor_url": "http://203.0.113.55/virus/eicar.com",
  "virus": "EICAR_TEST_FILE",
  "virusid": "2172"
}
PAN firewall logs
Pipeline condition: PAN-specific sourcetype values, listed as follows:
PAN predefined pipeline conditions
sourcetype IN ("pan:config", "pan:config:cloud", "pan:correlation", "pan:data:security", "pan:decryption", "pan:decryption:cloud", "pan:firewall", "pan:firewall:cloud", "pan:globalprotect", "pan:globalprotect:cloud", "pan:hipmatch", "pan:iot_alert", "pan:iot_device", "pan:iot_vulnerability", "pan:log", "pan:system", "pan:system:cloud", "pan:threat", "pan:threat:cloud", "pan:traffic", "pan:traffic:cloud", "pan:userid", "pan_config", "pan_decryption", "pan_globalprotect", "pan_log", "pan_system", "pan_threat", "pan_traffic")
Palo Alto Networks (PAN) Next-Generation Firewall logs store details about system events on the firewall and network traffic events that the firewall monitors. There are multiple formats of PAN firewall logs, each representing a specific event type, such as traffic, threat, or system events. See the PAN documentation to learn about log types and field descriptions.
This predefined pipeline provides parity with the Splunk Add-on for Palo Alto Networks.
Example event
Incoming log:
1,2026/06/03 14:22:35,015351000012345,TRAFFIC,end,2816,2026/06/03 14:22:35,192.168.10.45,203.0.113.46,203.0.113.10,203.0.113.46,Allow-Outbound-Web,corp\jsmith,,ssl,vsys1,trust,untrust,ethernet1/1,ethernet1/2,default-log-profile,,987654,1,54321,443,54321,443,0x400000,tcp,allow,125430,48200,77230,312,2026/06/03 14:22:10,25,computer-and-internet-security,,8472819203,0x8000000000000000,United States,United States,,198,114,tcp-fin,0,0,0,0,vsys1,PA-5250,from-policy,,,,0,,2026/06/03 14:22:10,N/A,0,0,0,0,e3c1f2a4-91d7-4b2e-b3f5-1a2c3d4e5f67,0,0,,,,,,,,,,,,,,,,,,,,,,Windows,corp-workstation,192.168.10.45,aa:bb:cc:11:22:33,,,,web-server,,,,,,0,,,browsing,general-internet,browser-based,3,has-known-vulnerability capable-of-circumventing-policy,web-browsing,0,no,yes,no,0,N/A,,,,,,,,,,,,0,0,0,0,0,0,,
Lumi user attributes:
{
    "action": "allowed",
    "src_zone": "trust",
    "src_translated_port": "54321",
    "client_ip": "192.168.10.45",
    "is_saas_of_app": "no",
    "src_ip": "192.168.10.45",
    "dvc_name": "PA-5250",
    "signature": "Allow-Outbound-Web",
    "protocol_version": "ipv4",
    "cluster_name": "N/A",
    "category_of_app": "general-internet",
    "dest_port": "443",
    "tunnel_id": "",
    "dest_ip": "203.0.113.46",
    "src_category": "",
    "app:used_by_malware": "yes",
    "sdwan_cluster_type": "",
    "tunnel_start_time": "2026/06/03 14:22:10",
    "app": "ssl",
    "vendor_action": "allow",
    "tunnel_session_id": "",
    "tunnel_monitor_tag": "0",
    "sdwan_device_type": "",
    "app:risk": "4",
    "tunnel_type": "N/A",
    "app:pervasive_use": "yes",
    "duration": "25",
    "dst_dag": "",
    "log_type": "TRAFFIC",
    "app:able_to_transfer_file": "yes",
    "chunks_sent": "0",
    "dst_profile": "",
    "packets": "312",
    "app:is_saas": "no",
    "src_interface": "ethernet1/1",
    "policy_id": "",
    "src_profile": "",
    "subcategory_of_app": "browsing",
    "http2_connection": "0",
    "nssai_sst": "",
    "src_dag": "",
    "dst_host": "docs-workstation",
    "sdwan_cluster": "",
    "serialnumber": "",
    "dst_osfamily": "",
    "dest_zone": "untrust",
    "src_vendor": "",
    "src": "192.168.10.45",
    "tunneled_app": "0",
    "session_flags": "0x400000",
    "src_user": "corp\\jsmith",
    "dynusergroup_name": "",
    "vendor_product": "Palo Alto Networks Firewall",
    "transport": "tcp",
    "chunks_received": "0",
    "rule": "Allow-Outbound-Web",
    "flow_type": "0",
    "action_source": "from-policy",
    "dst_mac": "192.168.10.45",
    "virtual_system": "vsys1",
    "vendor": "Palo Alto Networks",
    "dest_location": "United States",
    "src_osversion": "",
    "src_mac": "",
    "start_time": "2026/06/03 14:22:10",
    "session_owner": "",
    "dest_translated_ip": "203.0.113.46",
    "app:tunnels_other_application": "yes",
    "version": "2816",
    "session_id": "987654",
    "xff_ip": "",
    "app:default_ports": "tcp/443",
    "risk_of_app": "3",
    "src_location": "United States",
    "user": "corp\\jsmith",
    "src_host": "",
    "dst_edl": "web-server",
    "dest_user": "",
    "bytes_in": "77230",
    "dvc": "PA-5250",
    "client_location": "United States",
    "dst_category": "",
    "src_edl": "",
    "dest_interface": "ethernet1/2",
    "dst_osversion": "Windows",
    "app:has_known_vulnerability": "yes",
    "app:technology": "browser-based",
    "app:prone_to_misuse": "no",
    "src_translated_ip": "203.0.113.10",
    "http_category": "computer-and-internet-security",
    "vsys": "vsys1",
    "session_end_reason": "tcp-fin",
    "src_vm": "",
    "link_switches": "",
    "sanctioned_state_of_app": "yes",
    "container_id": "aa:bb:cc:11:22:33",
    "sourcetype": "pan:traffic",
    "serial_number": "015351000012345",
    "dest_vm": "",
    "server_location": "United States",
    "technology_of_app": "browser-based",
    "assoc_id": "0",
    "rule_uuid": "e3c1f2a4-91d7-4b2e-b3f5-1a2c3d4e5f67",
    "app:is_sanctioned_saas": "no",
    "dest": "203.0.113.46",
    "dst_model": "",
    "_indextime": "1780679067",
    "bytes_out": "48200",
    "app:evasive": "no",
    "src_port": "54321",
    "dest_translated_port": "443",
    "offloaded": "no",
    "sdwan_site": "",
    "nssai_sd": "",
    "receive_time": "2026/06/03 14:22:35",
    "src_osfamily": "",
    "hostid": "",
    "src_model": "",
    "dest_class": "unknown",
    "app:category": "networking",
    "protocol": "ip",
    "app:subcategory": "encrypted-tunnel",
    "product": "Firewall",
    "flags": "nat",
    "sequence_number": "8472819203",
    "bytes": "125430",
    "log_subtype": "end",
    "high_res_timestamp": "0",
    "packets_out": "198",
    "dst_vendor": "",
    "action_flags": "0x8000000000000000",
    "pod_name": "",
    "chunks": "0",
    "generated_time": "2026/06/03 14:22:35",
    "packets_in": "114",
    "characteristic_of_app": "has-known-vulnerability capable-of-circumventing-policy",
    "app:excessive_bandwidth": "no",
    "link_change_count": "0",
    "repeat_count": "1",
    "vsys_name": "vsys1",
    "container_of_app": "web-browsing",
    "src_class": "private",
    "server_ip": "203.0.113.46",
    "log_forwarding_profile": "default-log-profile",
    "pod_namespace": ""
}
PAN Traps logs
Pipeline conditions: sourcetype IN ("pan:analytics_traps", "pan:config_traps", "pan:system_traps", "pan:threat_traps", "pan:traps")
Palo Alto Networks (PAN) Traps logs originate from the Traps endpoint detection and response agent, now part of Cortex XDR. Traps logs come in several formats (analytics, config, system, and threat) and track information including agent configuration and malware prevention events. See the Cortex XDR documentation to learn about log types and field descriptions.
This predefined pipeline provides parity with the Palo Alto Networks Add-on for Splunk.
Example event
Incoming log:
analytics,agent_log,,hash_execution,agentFlow,2026-06-03T14:15:42Z,2026-06-03T14:15:55Z,2026-06-03T14:15:42Z,-420,,TrapsAgent,a1b2c3d4-1234-5678-abcd-ef0123456789,ext-tenant-99871,xdr-us-prod-01.paloaltonetworks.com,3.7.2.14102,10,1,9f8e7d6c-abcd-4321-ef12-0a1b2c3d4e5f,1,0,10.0.19045.3803,1,192.168.1.112,CORP-WKSTN-042,corp.example.com,5,7.2.4.44320,120-45678,0,e3b0c44298fc1c149afbf4c8996fb92427ae41e4649b934ca495991b7852b855,1,d9f8e7a6b5c4d3e2f1a0b9c8d7e6f5a4b3c2d1e0f9a8b7c6d5e4f3a2b1c0d9e8,2026-06-03T12:00:00Z,updater,C:\Users\jsmith\AppData\Local\Temp\updater,245760,{"contentVersion":"120-45678","laModuleVersion":"3.7.0","verdict":"benign","fileSigner":"Microsoft Corporation","trustedSignerResult":1},1,0,3
Lumi user attributes:
{
    "is_64bit": "1",
    "file_path": "C:\\Users\\jsmith\\AppData\\Local\\Temp\\updater",
    "dest_name": "CORP-WKSTN-042",
    "ids_type": "host",
    "tzoffset": "-420",
    "severity": "unknown",
    "category": "agentFlow",
    "_indextime": "1780679179",
    "dest_nt_domain": "corp.example.com",
    "sourcetype": "pan:analytics_traps",
    "reported": "laModuleVersion\":\"3.7.0",
    "is_vdi": "0",
    "server_time": "2026-06-03T14:15:55Z",
    "agent_id": "9f8e7d6c-abcd-4321-ef12-0a1b2c3d4e5f",
    "class": "agent_log",
    "region_id": "10",
    "os_version": "10.0.19045.3803",
    "file_hash": "e3b0c44298fc1c149afbf4c8996fb92427ae41e4649b934ca495991b7852b855",
    "vendor_product": "Palo Alto Networks Traps",
    "traps_id": "ext-tenant-99871",
    "src": "ext-tenant-99871",
    "agent_version": "7.2.4.44320",
    "os_type": "windows",
    "is_endpoint": "1",
    "log_subtype": "hash_execution",
    "facility": "TrapsAgent",
    "blocked": "verdict\":\"benign",
    "file_size": "245760",
    "last_seen": "2026-06-03T12:00:00Z",
    "log_severity": "unknown",
    "content_version": "120-45678",
    "generated_time": "2026-06-03T14:15:42Z",
    "server_host": "docs-us-prod-01.paloaltonetworks.com",
    "execution_count": "fileSigner\":\"Microsoft Corporation",
    "file_type": "1",
    "product": "Traps",
    "dest_ip": "192.168.1.112",
    "file_name": "updater",
    "record_type": "analytics",
    "server_component_version": "3.7.2.14102",
    "vendor": "Palo Alto Networks",
    "src_host": "docs-tenant-12345",
    "local_analysis_result": "{\"contentVersion\":\"120-45678\"",
    "customer_id": "a1b2c3d4-1234-5678-abcd-ef0123456789",
    "parent_hash": "d9f8e7a6b5c4d3e2f1a0b9c8d7e6f5a4b3c2d1e0f9a8b7c6d5e4f3a2b1c0d9e8",
    "protection_status": "0",
    "agent_time": "2026-06-03T14:15:42Z"
}
Unix and Linux logs
Pipeline conditions: sourcetype IN ("bash_history", "linux_secure")
Unix and Linux logs store information about events that occur on the operating system, such as system activity, kernel errors, and cron jobs. Logging is decentralized on Unix and Linux systems, although core system events typically follow the syslog protocol. For details and examples on the syslog format, see RFC 5424 as well as the older RFC 3164
This predefined pipeline provides parity with the Splunk Add-on for Unix and Linux.
Example event
Incoming log:
Aug 13 22:10:03 stor sudo: pam_unix(sudo:session): session closed for user root Aug 13 22:10:11 stor sudo: root : PWD=/ ; USER=root ; COMMAND=/usr/sbin/smartctl --scan
Lumi user attributes:
{
    "bash_command": "Aug 13 22:10:03 stor sudo: pam_unix(sudo:session): session closed for user root Aug 13 22:10:11 stor sudo: root : PWD=/ ; USER=root ; COMMAND=/usr/sbin/smartctl --scan",
    "USER": "root",
    "_indextime": "1780679883",
    "PWD": "/",
    "sourcetype": "bash_history",
    "COMMAND": "/usr/sbin/smartctl"
}
Windows event logs
Pipeline condition: Windows-specific sourcetype and source values, listed as follows:
Windows predefined pipeline conditions
sourcetype = "ActiveDirectory" OR
sourcetype = "DhcpSrvLog" OR
sourcetype = "WinEventLog" OR
sourcetype = "WinEventLog:*" OR
sourcetype = "XmlWinEventLog" OR
sourcetype = "XmlWinEventLog:*" OR
sourcetype = "WindowsUpdateLog" OR
sourcetype = "WinRegistry" OR
sourcetype = "WinHostMon" OR
sourcetype = "wmi" OR
sourcetype = "WMI:*" OR
sourcetype = "Perfmon:*" OR
sourcetype = "PerfmonMk:*" OR
sourcetype = "MSAD:*" OR
sourcetype = "Script:*" OR
source = "*WindowsUpdate.Log" OR
source = "WMI*" OR
source = "WinEventLog*" OR
source = "XmlWinEventLog*" OR
host = "WinEventLogForwardHost"
Windows event logs capture events for the Microsoft® Windows operating system and applications that run on it. Extracted user attributes in Lumi include computer name, error code, and event code.
The predefined pipeline operates on a general set of Windows event logs which can have different attributes depending on their origin and purpose. This is the same set of logs processed by the Splunk® Add-on for Microsoft Windows. For example:
- Core logs (
sourcetype=WinEventLog) - XML-formatted logs (
sourcetype=XmlWinEventLog) - Performance metrics (
sourcetype=Perfmon:*)
For an end-to-end example of using Windows event logs with Lumi, see How to send Windows event logs with S3 routing.
This predefined pipeline provides parity with the Splunk Add-on for Microsoft Windows.
Example event
Incoming log:
10/01/2025 04:47:46 PM LogName=System EventCode=7036 EventType=4 ComputerName=EC2AMAZ-EXAMPLE SourceName=Microsoft-Windows-Service Control Manager Type=Information RecordNumber=145454 Keywords=Classic TaskCategory=None OpCode=The operation completed successfully. Message=The Microsoft Account Sign-in Assistant service entered the stopped state.
Lumi user attributes:
{
  "message": "10/01/2025 04:47:46 PM LogName=System EventCode=7036 EventType=4 ComputerName=EC2AMAZ-EXAMPLE SourceName=Microsoft-Windows-Service Control Manager Type=Information RecordNumber=145454 Keywords=Classic TaskCategory=None OpCode=The operation completed successfully. Message=The Microsoft Account Sign-in Assistant service entered the stopped state.",
  "ComputerName": "EC2AMAZ-EXAMPLE",
  "Error_Code": null,
  "EventCode": 7036,
  "EventType": 4,
  "Keywords": "Classic",
  "LogName": "System",
  "Message": "The Microsoft Account Sign-in Assistant service entered the stopped state.",
  "OpCode": "The operation completed successfully.",
  "RecordNumber": 145454,
  "Service_Name": "Microsoft Account Sign-in Assistant",
  "SourceName": "Microsoft-Windows-Service Control Manager",
  "TaskCategory": "None",
  "Type": "Information",
  "_cooked": "_cooked",
  "_path": "C:\\Program Files\\MyApplication\\bin\\myapp.exe",
  "_pre_msg": "10/01/2025 04:47:46 PM LogName=System EventCode=7036 EventType=4 ComputerName=EC2AMAZ-EXAMPLE SourceName=Microsoft-Windows-Service Control Manager Type=Information RecordNumber=145454 Keywords=Classic TaskCategory=None OpCode=The operation completed successfully.",
  "_savedHost": "host::198.0.2.144",
  "_savedPort": 9998,
  "_sourcetype": "WinEventLog:System",
  "body": "The Microsoft Account Sign-in Assistant service entered the stopped state.",
  "category": "None",
  "dest": "EC2AMAZ-EXAMPLE",
  "dvc": "EC2AMAZ-EXAMPLE",
  "dvc_nt_host": "EC2AMAZ-EXAMPLE",
  "event_id": 145454,
  "hf_proxy": "meta_test",
  "host": "EC2AMAZ-EXAMPLE",
  "id": 145454,
  "index": "wineventlog",
  "package": 7036,
  "product": "Windows",
  "remoteport": 51391,
  "service": "Microsoft Account Sign-in Assistant",
  "service_name": "Microsoft Account Sign-in Assistant",
  "severity_id": 4,
  "signature_id": 7036,
  "source": "WinEventLog:System",
  "sourcetype": "WinEventLog",
  "status": "stopped",
  "vendor": "Microsoft",
  "vendor_product": "Microsoft Windows"
}
Zscaler NSS logs
Pipeline conditions: sourcetype IN ("zscalernss-fw", "zscalernss-web")
Zscaler Nanolog Streaming Service (NSS) collects and forwards event logs from a Nanolog.
The predefined pipeline in Lumi processes Web and Firewall logs from Zscaler NSS.
Incoming events must be in key-value pair format using the equality (=) separator. For example, log_subtype=nss_web.
This predefined pipeline provides parity with the Zscaler Technical Add-On for Splunk.
Example event
Incoming log:
Jun 19 08:00:04 10.100.30.13 datetime=Fri Jun 19 07:59:00 2026 log_subtype=nss_fw user=012345678 locationname=Remote cdport=443 csport=8000 sdport=1234 ssport=12345 csip=192.0.2.0 cdip=192.0.2.0 ssip=192.0.2.0 sdip=192.0.2.0 tsip=0.0.0.0 tunsport=0 tuntype=ZscalerClientConnector action=Drop dnat=No stateful=Yes aggregate=No nwsvc=TCP_ANY nwapp=google proto=TCP ipcat=Web Search destcountry=United States avgduration=113 rulelabel=Default Firewall Filtering Rule inbytes=7890 outbytes=3456 duration=0 durationms=113 numsessions=1 vendor=Zscaler product=fw department=Admin
Lumi user attributes:
{
    "rulelabel": "Default Firewall Filtering Rule",
    "tunsport": "0",
    "src_zone": "Remote",
    "src_ip": "192.0.2.0",
    "stateful": "Yes",
    "csip": "192.0.2.0",
    "dest_translated_ip": "192.0.2.0",
    "cdip": "192.0.2.0",
    "tuntype": "ZscalerClientConnector",
    "dest": "192.0.2.0",
    "outbytes": "3456",
    "app": "Zscaler",
    "duration": "0",
    "department": "Admin",
    "durationms": "113",
    "protocol": "TCP",
    "dest_ip": "192.0.2.0",
    "action": "Drop",
    "bytes": 11346,
    "vendor_product": "Zscaler_ZIA_Firewall",
    "bytes_in": "7890",
    "product": "fw",
    "avgduration": "113",
    "dnat": "No",
    "proto": "TCP",
    "destcountry": "United States",
    "csport": "8000",
    "nwsvc": "TCP_ANY",
    "bytes_out": "3456",
    "cdport": "443",
    "vendor": "Zscaler",
    "aggregate": "No",
    "numsessions": "1",
    "inbytes": "7890",
    "nwapp": "google",
    "locationname": "Remote",
    "user": "012345678",
    "_indextime": "1780679673",
    "dest_translated_port": "1234",
    "transport": "TCP",
    "ssport": "12345",
    "sdip": "192.0.2.0",
    "dest_port": "443",
    "ssip": "192.0.2.0",
    "ipcat": "Web Search",
    "tsip": "0.0.0.0",
    "src_translated_ip": "0.0.0.0",
    "sdport": "1234",
    "log_subtype": "nss_fw",
    "src": "192.0.2.0",
    "sourcetype": "zscalernss-fw",
    "src_port": "8000",
    "src_translated_port": "8000"
}
Learn more
See the following topics for more information:
- Work with predefined pipelines to learn about predefined pipelines and how to use them.
- Transform events using pipelines for an overview of pipelines and processors.
- Manage pipelines and processors for how to create and manage pipelines and processors.