Manage data cubes
A data cube is a multidimensional data model used to organize and visualize aggregated data. Data cubes contain data from one or more tables and provide an interface for users to explore a data set. This topic explains how to create and configure a data cube in Imply Polaris.
View data cubes
Click Data cubes in the left sidebar to view all data cubes.
You can click the star icon on the right side of a data cube in the list to identify it as a favorite. Polaris displays favorites at the top of the page for easy access.
Click the name of a data cube to view its dimensions and measures and use visualizations to analyze the data.
Click the info icon next to the data cube name to display when the data cube was last updated, the name of the underlying table, the number of dimensions and measures, and the data cube ID:
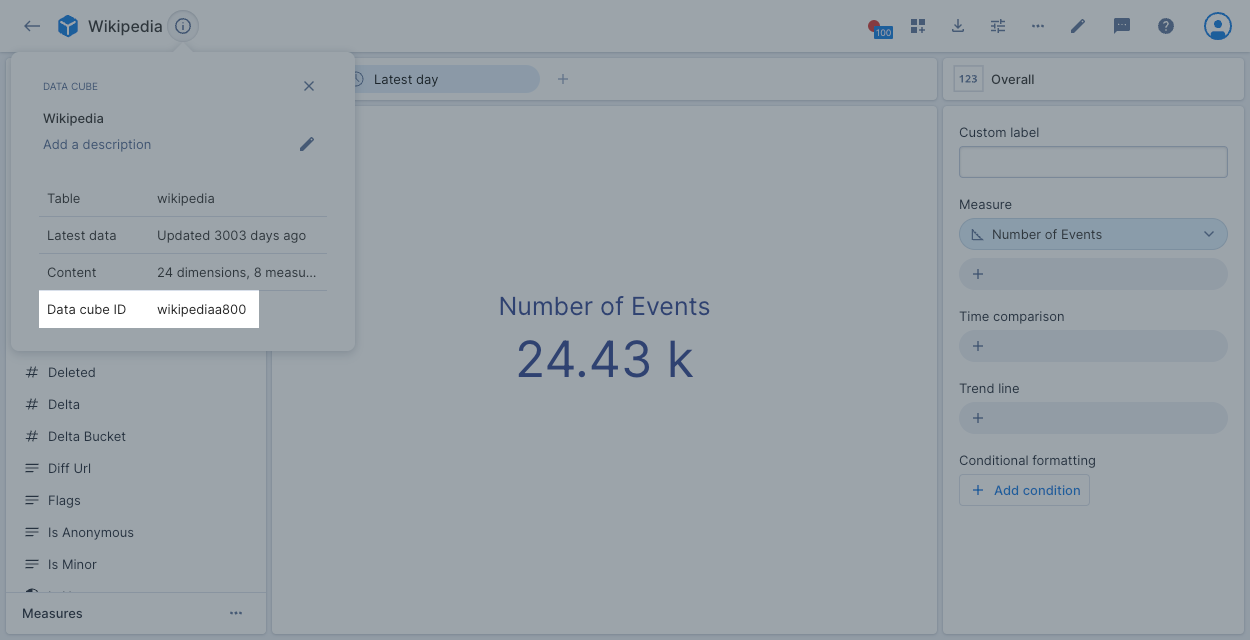
You use the data cube ID to query the data cube using the Data cube query API.
Create a data cube
A data cube contains data from one or more tables. Before you create a data cube, verify that the data you want to present in a data cube is available in a table. See the Data overview to learn about creating tables and loading data.
Users with AdministerDataCubes or ManageDataCubes permissions can create data cubes in Polaris. See Permissions assigned to predefined groups for default permission assignments.
To create a data cube, follow these steps:
- Click Data cubes > Create data cube.
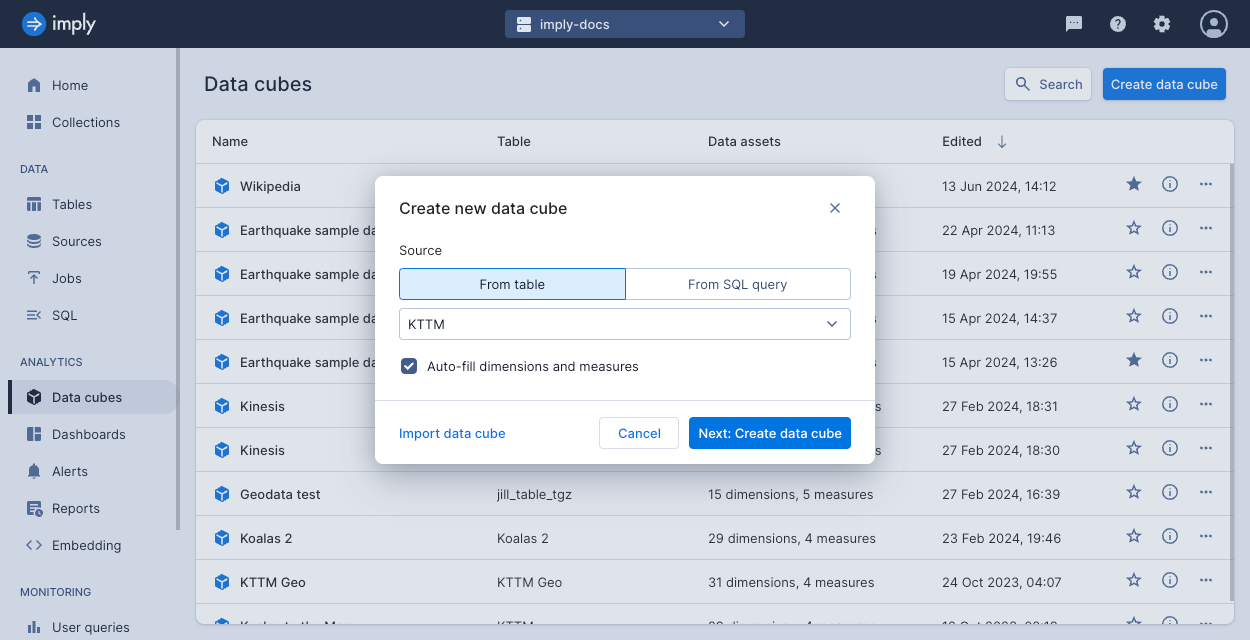
- Select one of the following options:
- From table: Select a Polaris table from the drop-down.
- From SQL query: Write a query that selects data used to populate the data cube. You can add queries against any data source. Use this option if you want to populate the data cube with a subset of a table's data, or you otherwise want to use a SQL query to select and manipulate the data.
- Import data cube: Import the JSON definition of a data cube. You can export a definition when you edit a data cube.
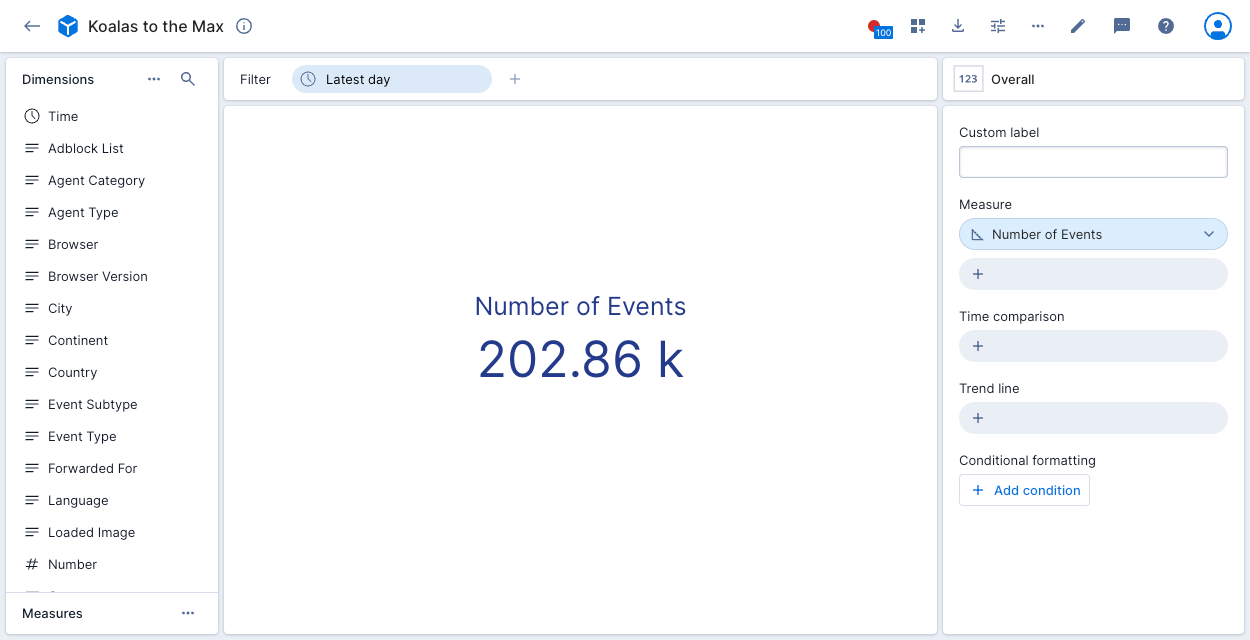
- Choose whether to Auto-fill dimensions and measures (recommended). When enabled, Polaris creates a dimension for each column in the table. It also makes some inferences about the data to create several measures. For instance, it creates a measure that represents the count of events returned by the query underlying the data cube. The following figure shows the dimensions created based on the Koalas to the Max data:
Polaris does not auto-generate dimensions for array-type data in the schema and does not support arrays. For more information about dimension and measure detection, see Schema detection.
- Click Next: Create data cube.
- Complete the General properties for the data cube:
- Name: Name of the data cube.
- Description: An optional description.
- Source: The data source you selected in the initial dialog. You can change it here if required.
- Default timezone: The data cube's timezone.
- Minimum refresh rate: The minimum rate at which data in the data cube refreshes.
- Primary time dimension: The time dimension Polaris uses for all time-related calculations for this data cube, including comparisons, filters, alerts, and reports.
- Query timeout override: The optional number of milliseconds to override the default 40-second query timeout. Setting this value higher than 660,000 (11 minutes) overrides the default value for the client timeout, which is 660,000.
- Click Dimensions to add or modify dimensions.
- Click Measures to add or modify measures.
- Click Access to control access to the data cube. See Data cube access for more information.
- Click Access filters apply a SQL predicate to a data cube's underlying data. See Access filters for more information.
- Click Customize to set the following options:
- Data cube UI colors: Set colors to apply to the data cube icon, measure, and dimension pills. You can select from the predefined palettes or enter 6-digit hex color codes.
- Comparison periods: Click Add Compare to create a custom comparison period. Enter a Time length and select a Unit, for example
3 days. Custom comparison periods appear in the Comparisons drop-down when you're exploring a data cube.
- Click Advanced to set the following advanced options:
- Enforce time filter: Ensures that every query is filtered on the primary time dimension. You can enable this setting if time unbounded queries are likely to be slow due to the volume of data.
- Latest data strategy: Determines how Polaris calculates the latest data time for the data cube. Options are:
- Query the latest timestamp from the table: The best option when loading historical data.
- Query the latest timestamp from the table, relative to the last full day: Select if you don't want to include data from incomplete days.
- Use the current time: The best option when ingesting real-time data.
- Latest time filter granularity: When using a relative time filter, Polaris uses this level of granularity to align the filter boundaries when querying the underlying table. For an aggregate table, set to the same granularity used during ingestion or use Infer from latest timestamp. For a detail table, use Infer from latest timestamp.
- Query caching: Specifies query caching behavior. Allowing caching can greatly speed up exploration but can also cause results to be out of date, especially in real-time rolled up datasets.
- Dimension and measure formulae visibility: Hides formulae that appear in the info dialog for dimensions and measures. Polaris displays formulae by default. Users with appropriate permissions can see formulae in edit mode, regardless of this setting.
- Minimum alert frequency and Minimum alert timeframe: The minimum allowed frequency and timeframe for alerts created for this data cube. If set, these options become the minimum Check every and Time frame options for alerts. Users with the
CreateElevatedAlertspermission are not subject to these restrictions when creating alerts. - Split limits: Optional comma-separated list of numbers to override the default options in the Limit drop-down:
5, 10, 25, 50, 100. - Priority: Number for Polaris to pass as priority to the Druid query context. Default is
0. - Exact results only: Disables approximation and sets query precision to Exact for ranking (TopN) and aggregation (COUNT DISTINCT) queries. This setting improves accuracy but can degrade query performance. When enabled, users can't switch between Approximate and Exact. For certain visualizations, the underlying query may ignore approximation settings. For an example, see Flat Table.
- Boost prefix filter matches: Changes the default sort order for string filter search matches. By default, Polaris orders results by their cardinality in the table. With this option enabled, Polaris orders results with prefix matches first in search results.
- Hide 'overall' visualization elements by default: Hides the overall element for visualizations created from this data cube. To turn it on in an individual visualization, click a dimension pill and select Overall > Show.
- Use custom relative time presets: Define and use your own presets for current and latest time ranges.
- Time series max entries: Maximum number of entries allowed in a time series visualization. Overrides the default value of 500,000.
- Click Save to save the data cube.
After you create a data cube, you can adjust any settings in the edit screen.
You can create additional data cubes by duplicating existing data cubes and editing their configuration.
Edit a data cube
To edit a data cube, click the ellipsis next to the data cube name on the Data cubes page, or in Favorites or Collections. When viewing a data cube, click the pencil icon in the data cube header.
Within the edit view, you can change the data cube properties described in Create a data cube.
Click the ellipses at the top of the page and select Export to export the JSON definition of the data cube. You can import a data cube definition when you create a data cube.
If the underlying schema of the table changes, you can update the data cube schema as well. To do so, access the Dimensions or Measures tab in the Edit data cube view. If there are changes to the underlying schema, the Suggestions button indicates the number of changes detected. Click the Suggestions button to review and accept the suggestions as needed.
For more information about schema detection, see Schema detection.
Manage access
By default, all users in your project can view a newly created data cube and all of its underlying data. You can use the Access and Access filters tabs to optionally control access to individual data cubes, and filter the data specified user groups can access in the data cube.
Data cube access
The data cube creator and users with the AdministerDataCubes permission assigned to their profile can edit the data cube. See Permissions reference for more information on permissions.
To control access to an individual data cube at a more granular level:
- Edit the data cube and click the Access tab.
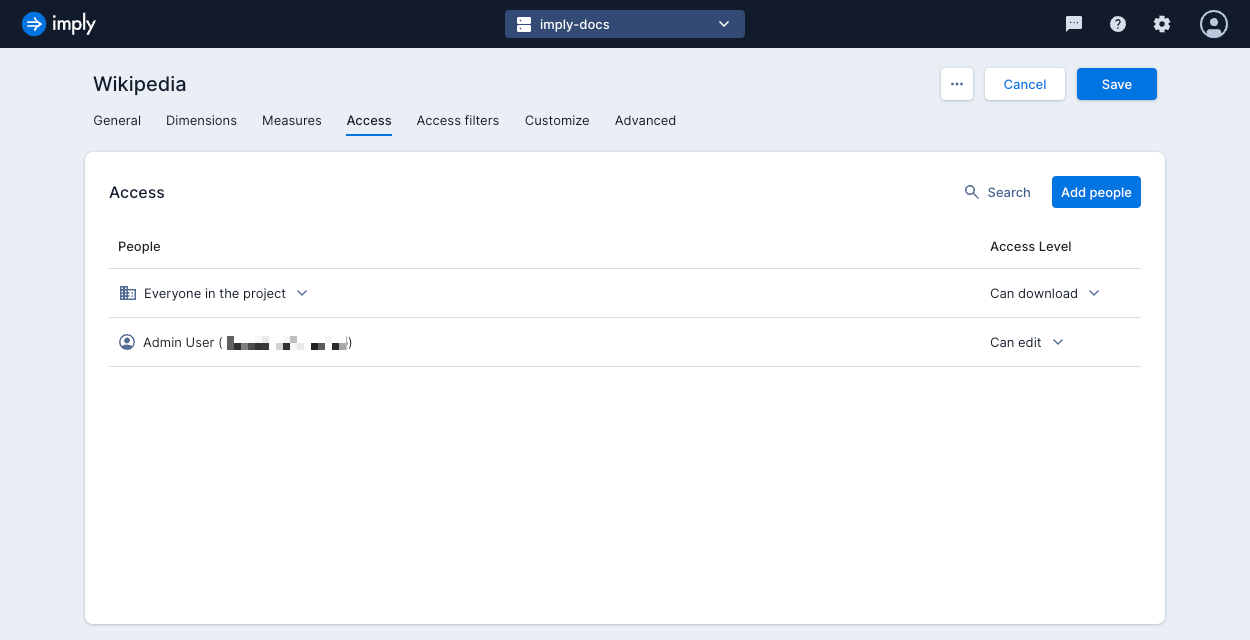
- Click Add people.
- Select one or more options from the drop-down lists for the following access levels:
- Can view: View the data cube. Users with this access level also need the
AccessVisualizationpermission assigned to their profile. - Can download: View and download the data cube. Users with this access level also need the
AccessDownloadDatapermission assigned to their profile. - Can edit: View, download, and edit the data cube. Users with this access level also need the
ManageDataCubesorAdministerDataCubespermission assigned to their profile.
- Can view: View the data cube. Users with this access level also need the
In cases where different permissions on the individual level and the group level apply to the same user, Polaris applies the most privileged permission. For example, if an individual user has Can view access to a data cube, but they are a member of a group with Can edit access, they have permission to edit the data cube.
Access filters
Access filters allow you to apply a SQL predicate to a data cube's underlying data. You assign the access filter to one of the following:
- A user group, so that members of the group view the filtered data when they access the data cube. Access filters are transparent to group members—Polaris provides no indication that they are viewing filtered data.
- An API key, so that you can use the Data cube query API to query a data cube that has an access filter applied. See Authenticate with API keys for information on creating API keys in Polaris.
The following rules apply to access filters:
- You can assign each access filter to a single user group or API key.
- A user group or API key can only be assigned to one access filter.
- You can create multiple access filters for the same data cube. This allows different user groups and API keys to have distinct filtered views of the underlying data.
Access filter SQL syntax
Preface column references with t. when you define an access filter. For example:
t.channel in ('#fr.wikipedia', '#sh.wikipedia') and t.added > 300
You can reference the __time column as well as CURRENT_DATE and CURRENT_TIMESTAMP in access filter SQL. For example, apply the following SQL to allow access to data for the past 30 days:
t.__time > TIMESTAMPADD(DAY, -30, CURRENT_DATE)
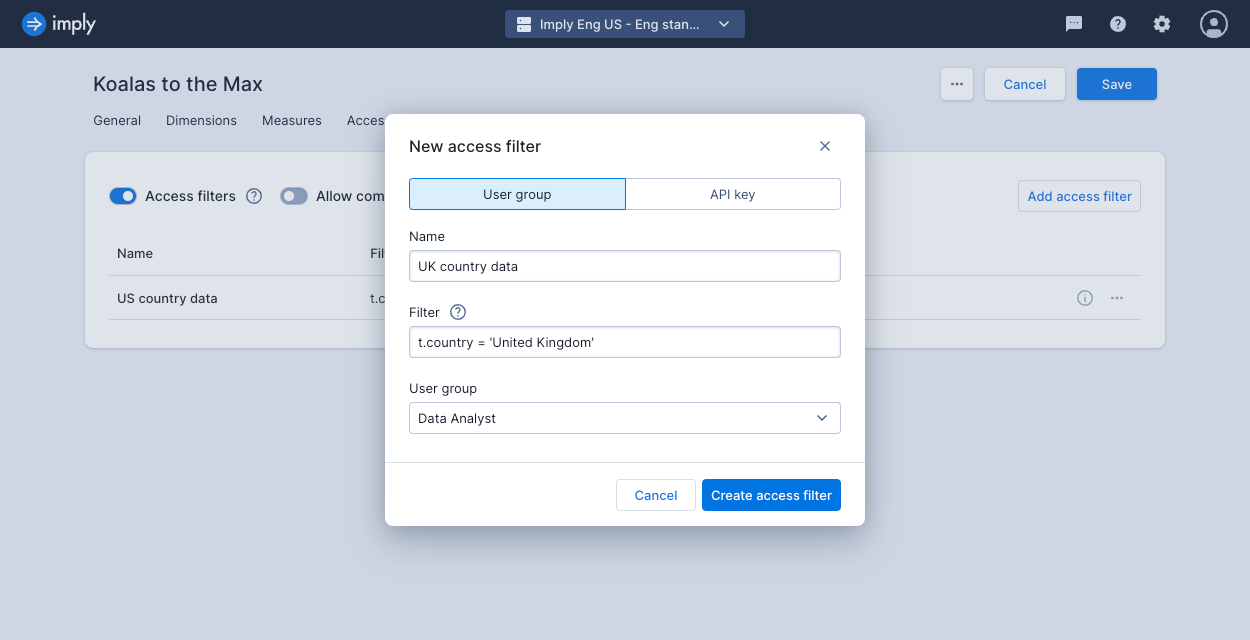
Create an access filter
To create an access filter:
- Create or edit a data cube and access the Access filters tab.
- Click Access filters.
Once you enable access filters, only group members or API keys with applied access filters can query the data cube.
- Click Add access filter and enter the following details:
- Name: A name for the access filter.
- Filter: A SQL query to select data for the filter. Preface column names with
t.—for example,t.country. - User group or API key: Select a single user group or a single API key to attach to the filter.
 If you want multiple API keys or multiple user groups to use the same filter for a data cube, you must create separate access filters for each group or API key using the same SQL.
- Click Create access filter.
- Use the Allow combining multiple filters checkbox to determine the behaviour when a user is a member of two or more user groups with access filters applied:
- If checked, Polaris combines the filters with the OR operator.
- If unchecked, the user can't view any data in the data cube.
- Click Save.
Access filters example
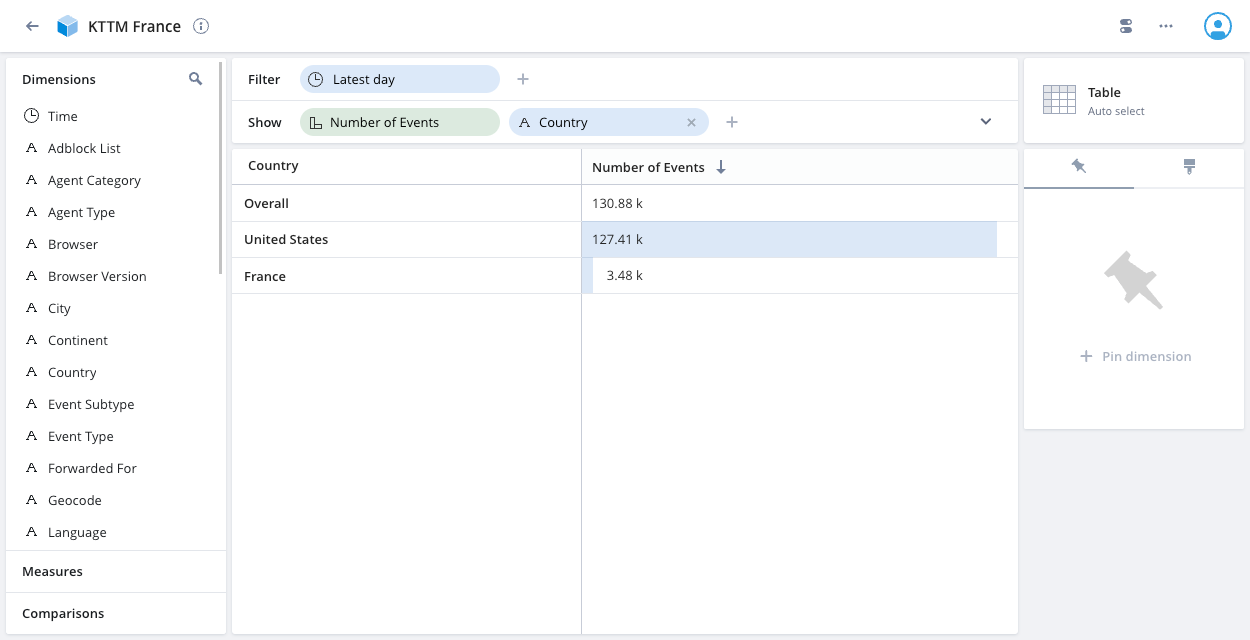
Let’s say you're using the Koalas to the Max datasource described in the Quickstart.
You have groups of data analysts in France and Germany. You only want the analysts to view data for their home country plus data for the United States.
The following steps illustrate how to set up two filtered views of the same Polaris data:
- Create a user group named
Analysts Franceand a user group namedAnalysts Germany, and assign the appropriate analysts to each. - Create a data cube on the Koalas to the Max data source named
KTTM. - Create an access filter on the data cube with Filter:
t.country IN ('France', 'United States')and assign it to User group:Analysts France. - Create another access filter on the data cube with Filter:
t.country IN ('Germany', 'United States')and assign it to User group:Analysts Germany. - View the
KTTMdata cube as an analyst in France and as an analyst in Germany, and confirm that the data is filtered as expected.
Filtered KTTM data cube for data analysts in France:
Filtered KTTM data cube for data analysts in Germany:

Create a link to a data cube
You can create a URL that links directly to a data cube. See Query parameters reference for information on the query parameters Polaris supports in the URL.
Schema detection
The dimensions and measures of a data cube make up the schema for the data cube. When you create a data cube, Polaris can derive the schema from the base data source, which you can modify as needed.
How schema detection works
Imply looks at the dataset metadata and uses the returned list of columns, their types, and their aggregation (in case of rollup) to determine what dimensions and measures to suggest.
Imply generates dimensions and measures by applying the following rules to the discovered underlying column types:
- Time columns get mapped to a dimension with automatic bucketing by default.
- String columns get mapped to a dimension.
- Numeric columns get mapped to a
SUMmeasure or an otherwise appropriate measure if the column is marked as being aggregated as part of rollup.
Schema detection limitations
While schema detection enables you to set up a new data cube quickly, you may need to test it and tailor it to suit your needs. Try modifying or deleting the auto-generated dimensions or measures. You can always access them in the Suggestions tab if you decide to revert back.
Specifically, schema detection cannot detect the following:
- Array data.
- String columns that you might want to see as
countDistinct- number of unique values. - The perfect granularities to apply to time and numeric dimensions.
- Lookups that you might want to apply to certain dimensions.
- Dimensions that correspond to a URL.
- Measures that are interesting when filtered on something.
- Measures that should be seen as a ratio, or some other post aggregation.
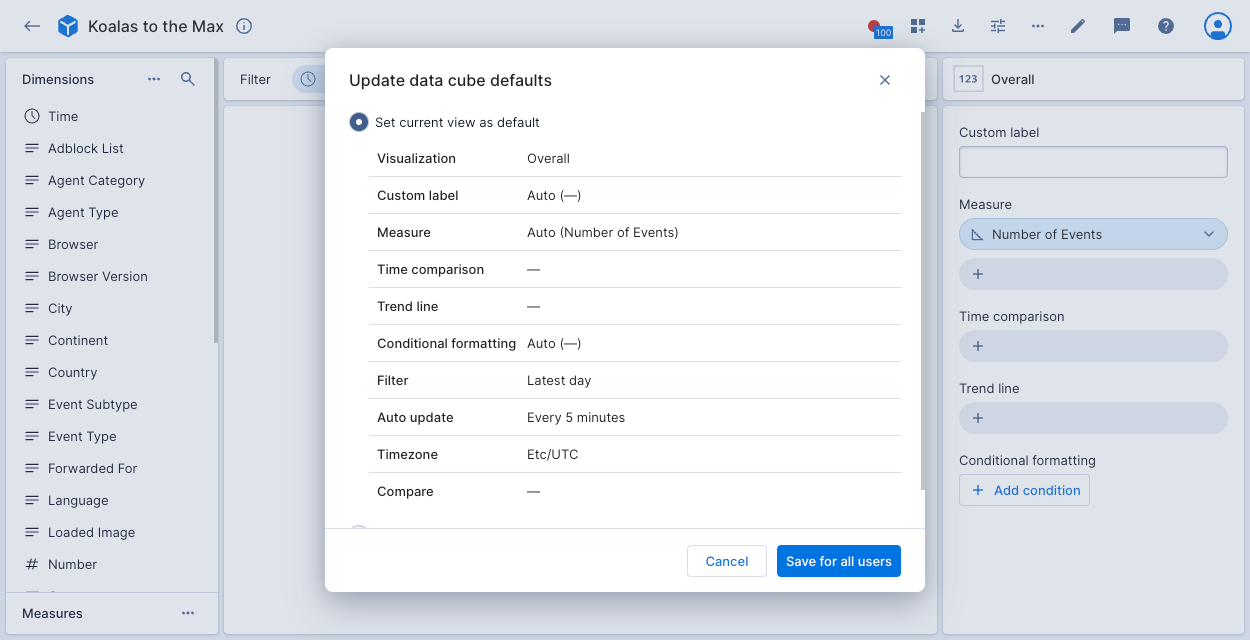
Set a default data cube view
When a user navigates to a data cube, the data cube displays data from the latest day and shows the first measure in the list of available measures by default.
You can modify this default view by adding filtering conditions or by setting a specific dimension to be shown with the default settings.
Create a default view:
- Create the view you want to save as your default view in the data cube.
- Open the options menu by clicking the toggle icon at the top right of the data cube view.
- Click Update data cube defaults.
- Click Set current view as default.
- Click Save for all users.
Data cube options
Click the options icon in the top navigation bar to set the following data cube options:
- Timezone: Set the data cube’s timezone. Click the cog icon to change the timezone for all data cubes and dashboards:
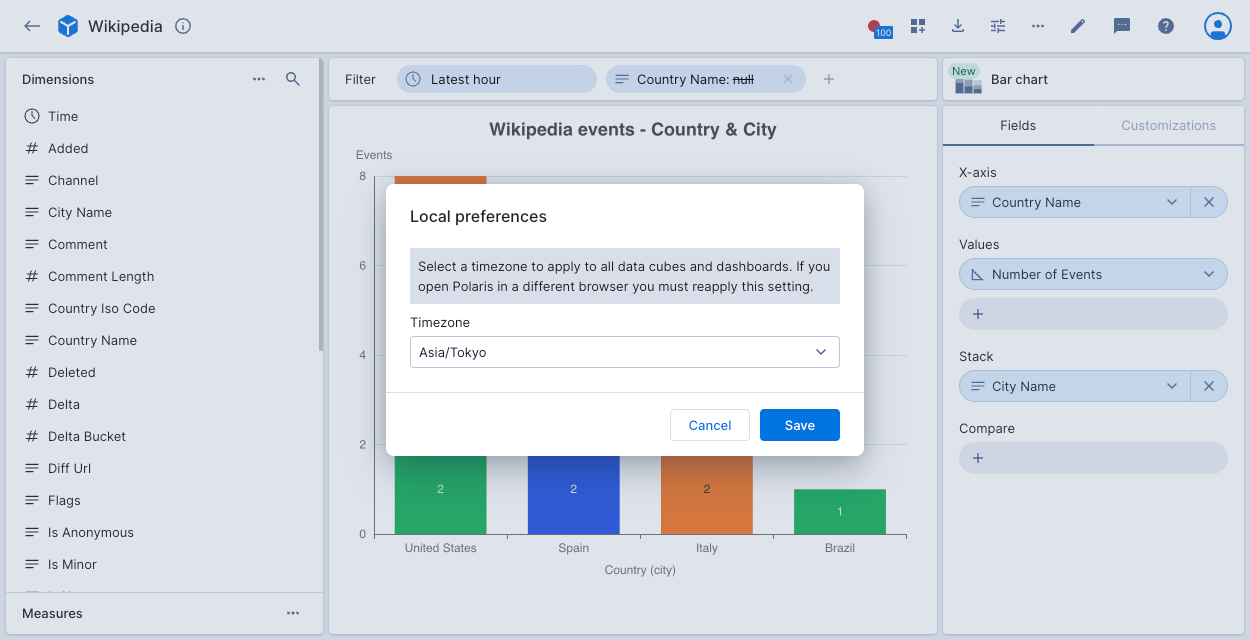 If you open Polaris in another browser you must reapply this setting.
 - Query cache: Enable or disable the query cache for all dashboards and data cubes. The cache setting persists until you reload the page. The cache optimizes query performance, but can cause results to be slightly out of date—especially for stream-ingested rolled-up datasources.
- Query precision: Controls the precision of TopN and COUNT DISTINCT queries. Defaults to Approximate. Select Exact to improve accuracy in reported metrics—note that this setting can affect query performance.
- Refresh rate: Set the rate at which data in the data cube refreshes.
- View raw data: View and download the raw data underlying the data cube.
- View essence: View and copy the JSON structure of the data cube.
- Monitor queries: View the underlying queries Polaris executes when you’re working with the data cube. Click Enable monitoring in the dialog to enable the feature. Once enabled, you can view the time and type of each query. Click a query to see the SQL, copy to clipboard, and open the SQL in query view.
- Update data cube defaults: Update the initial settings for the data cube view when you first navigate to it.
- Reset view: Reset the data cube view to the default view.
Click the ellipsis in the top navigation bar to access the following options:
- Schedule report: Set up a report for this data cube.
- Embed this view: Create an embedding link to this data cube view.
- Add to/Remove from favorites: Mark the data cube as a favorite or remove it from your favorites.
- Add to collection: Add the data cube to a collection.
Click the download icon in the top navigation bar to download data from the data cube. See Download data for more information.