Monitoring metrics
This topic describes how to monitor your projects using the metrics in Imply Polaris.
For information on all monitoring features available in Polaris, see the Monitoring overview.
Prerequisites
Members of the Organization Admin, Project Admin, and Data Manager groups as well as users with the AccessMonitoring permission assigned to their profile can view all Polaris monitoring pages.
For information on permissions, see Permissions reference.
Monitoring dashboards
There are two types of monitoring metrics in Polaris—User queries metrics and Streaming metrics. To access them, click User queries or Streaming in the left pane.
These pages provide a visual representation of several Polaris metrics as dashboards. Clicking on a data point in one dashboard updates the data displayed in the other dashboards.
This section describes the actions you can take on each metrics page to navigate the data.
Navigate the data
You can use the following options on the metrics pages to drill down into the data:
- FILTERS bar: Use the filters bar at the top of the page to select a relative time period to display or define a fixed period. Use the plus icon to select more metrics to filter on.
- Time comparison: Select a time period for comparison or define a custom period.
- Info icons: Click the info icon on any dashboard to display information about it.
- Expand tile icons: Click the expand tile icon on any dashboard to open and explore the data in the detailed metrics view.
By default, the dashboards display an aggregate view across all tables. To filter by a specific table, click into a dashboard and select a table.
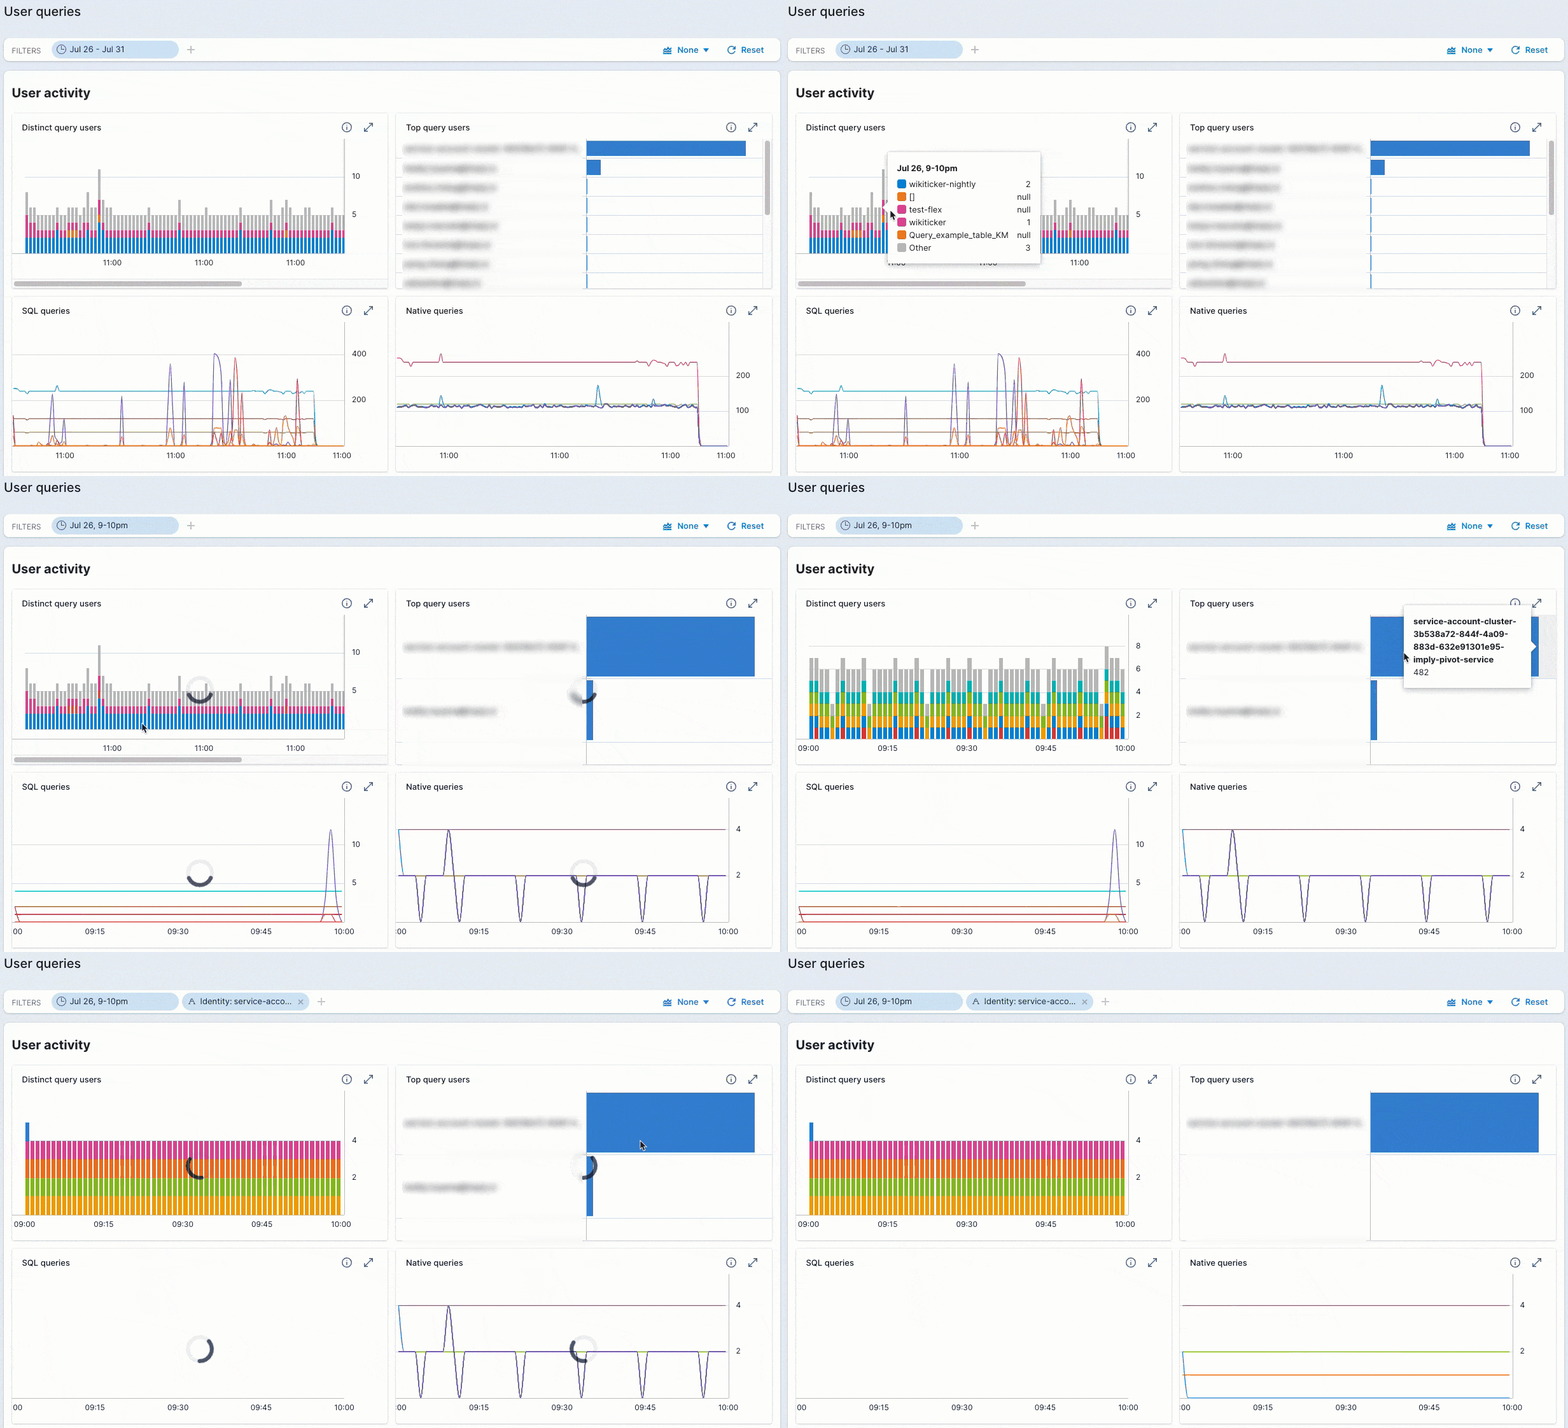
In the following example, filtering on a table in the User queries dashboard updates the other dashboards to reflect user activity in that table. Filtering on a particular user further restricts the displays to show activity by that user.

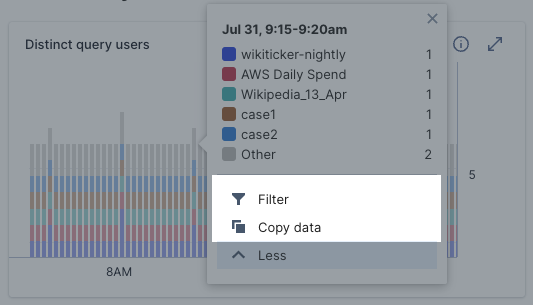
Click a data point inside a dashboard then click More to see more options:

- Filter: Filter the user queries dashboards by the selected data.
- Copy data: Copy the selected data to the clipboard. For example:
{"Time":{"start":"2024-07-31T07:45:00.000Z","end":"2024-07-31T07:50:00.000Z"},"Distinct Users":2}