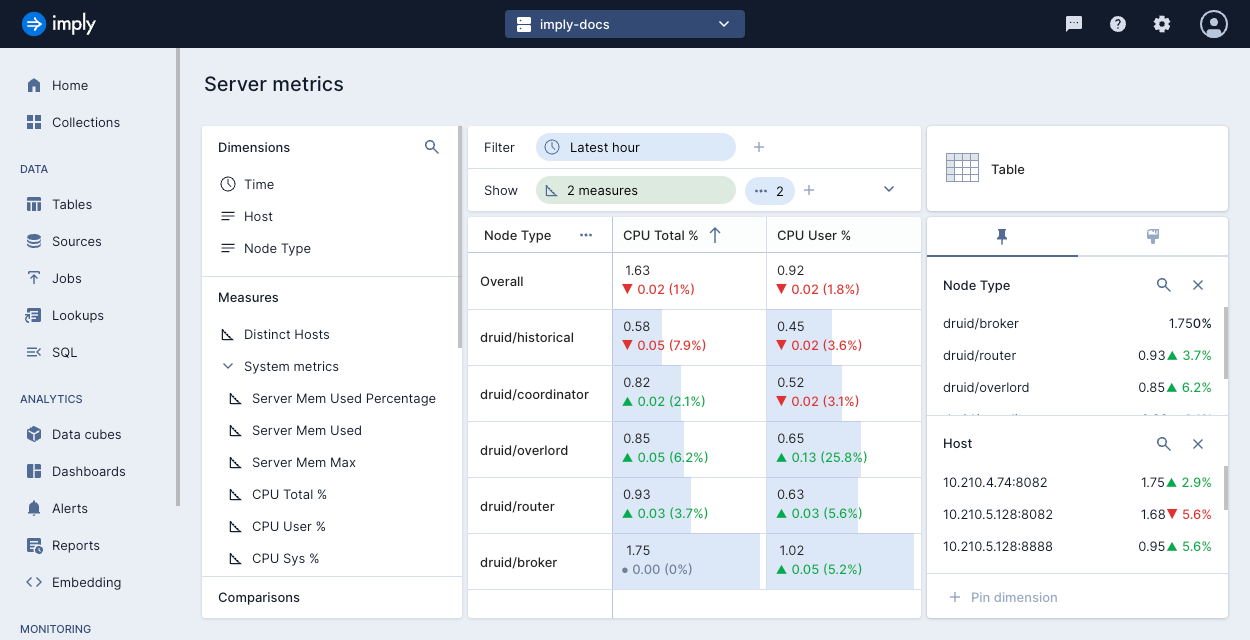
Server metrics
This topic describes how to monitoror your Imply Polaris projects using the server metrics page.
For information on all monitoring features available in Polaris, see the Monitoring overview.
Prerequisites
Members of the Organization Admin, Project Admin, and Data Manager groups as well as users with the AccessMonitoring permission assigned to their profile can view all Polaris monitoring pages.
For information on permissions, see Permissions reference.
View server metrics
To view server metrics in Polaris, click Server metrics in the left pane.
You can use this page to view details of the Druid services for your Polaris projects:
Use the standard data cube functionality to:
- Select a visualization.
- Show dimensions and measures.
- Add filters.
Depending on the visualization you choose, you might be able to configure more options such as:
- Adding rows and columns.
- Comparing the data to a previous period.
- Adding multiples to display several groups of data.
- Adding a layer or stack to display more dimensions in the visualization.
On the right side of the page you can further refine the data by selecting one or more Druid node types, and one or more Druid hosts.
The following table visualization shows server metrics for the latest hour compared to the previous period. The table displays CPU Total % and CPU User % for each Node Type.
