User queries metrics reference
This topic provides a reference for the user query metrics available in Imply Polaris. You can use the user query dashboards to monitor and analyze query performance in general and in relation to specific users.
See Monitoring dashboards for prerequities and information on how to navigate the dashboards. For information on all monitoring features available in Polaris, see the Monitoring overview.
Click User queries in the Monitoring section of the left pane to access the dashboards.
User activity
This section describes the user activity dashboards.
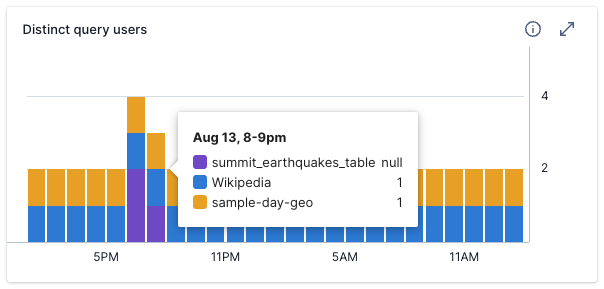
Distinct query users
Shows the number of users who executed Polaris queries, grouped by table queried.
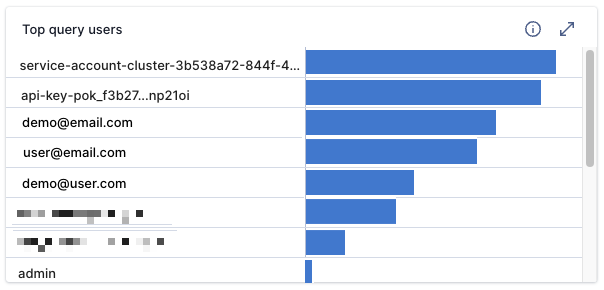
Top query users
Shows the top users who executed Polaris queries, in descending order of the number of queries executed. Excludes metadata queries.
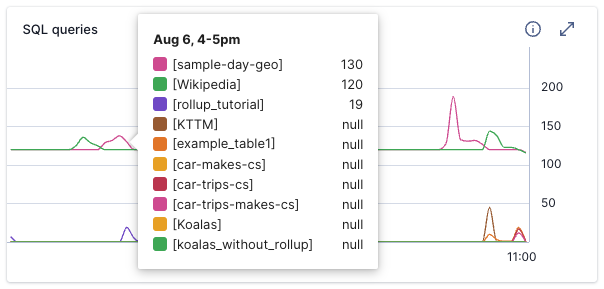
SQL queries
Shows the number of SQL queries Polaris executed, grouped by table. Excludes queries run by SQL-based ingestion jobs.
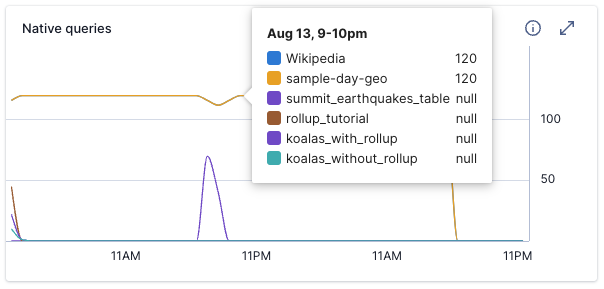
Native queries
Shows the number of native queries Polaris executed, grouped by table. Note that a single SQL query can execute one or more native queries.
Query performance
This section describes the query performance dashboards.
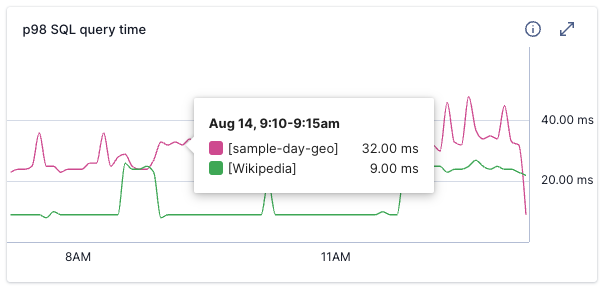
p98 SQL query time
Shows the 98th percentile of time taken by Polaris to complete a SQL query, grouped by table.
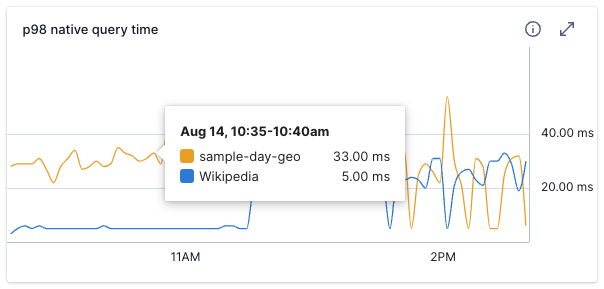
p98 native query time
Shows the 98th percentile of time taken by Polaris to complete a native query, in milliseconds, grouped by table.
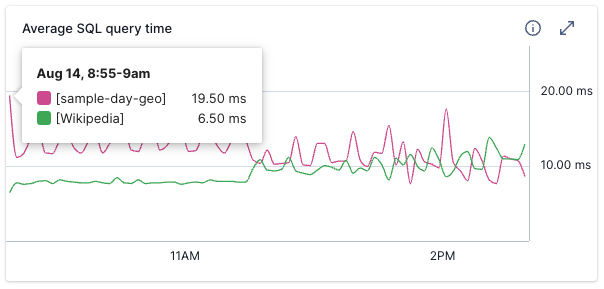
Average SQL query time
Shows the average time Polaris took to complete a SQL query, in milliseconds, grouped by table.
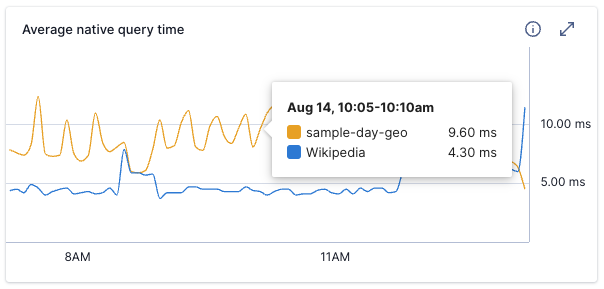
Average native query time
Shows the average time Polaris took to complete a native query, in milliseconds, grouped by table.
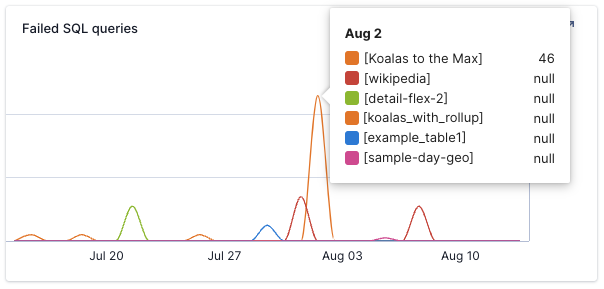
Failed SQL queries
Shows the number of failed SQL queries, grouped by table.
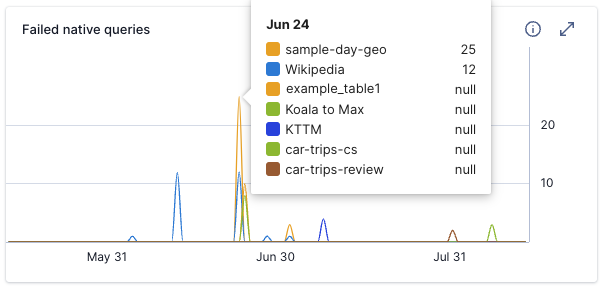
Failed native queries
Shows the number of failed native queries, grouped by table.
Query saturation
This section describes the query saturation dashboards.
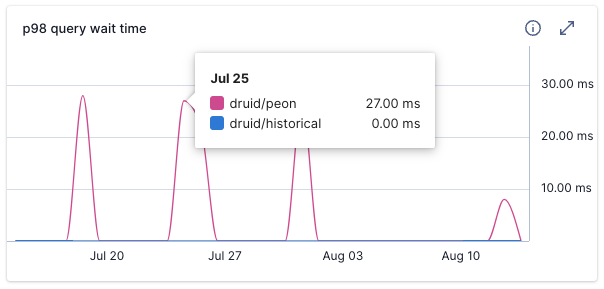
p98 query wait time
Shows the 98th percentile of time taken for Polaris to run queries, in milliseconds, grouped by node type.
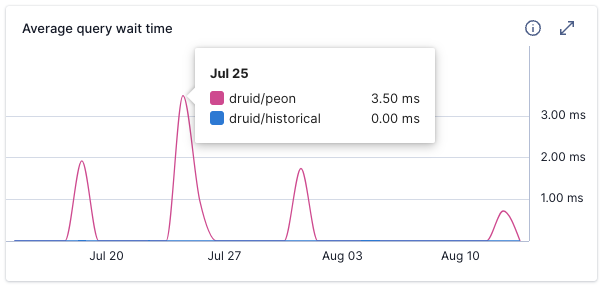
Average query wait time
Shows the average time taken for Polaris to run queries, in milliseconds, grouped by node type.
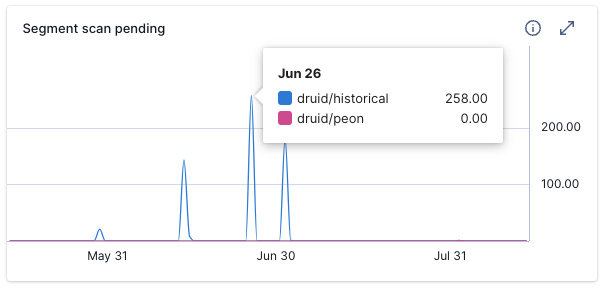
Segment scan pending
Shows the number of segments in the queue awaiting scan.
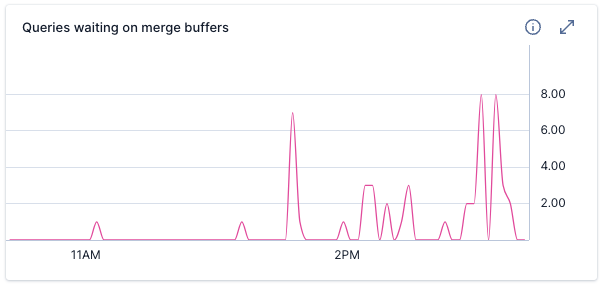
Queries waiting on merge buffers
Shows the number of queries waiting to acquire a batch of buffers from the merge buffer pool.
Query processing
This section describes the query processing dashboards.
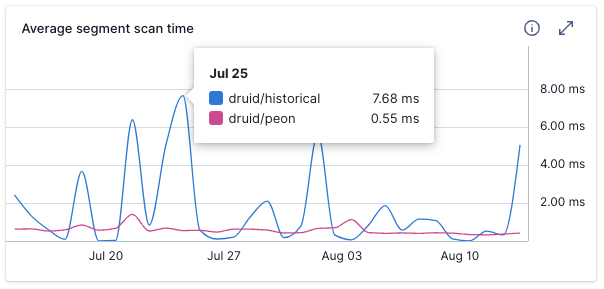
Average segment scan time
Shows the average time taken to query a segment, in milliseconds, grouped by node.
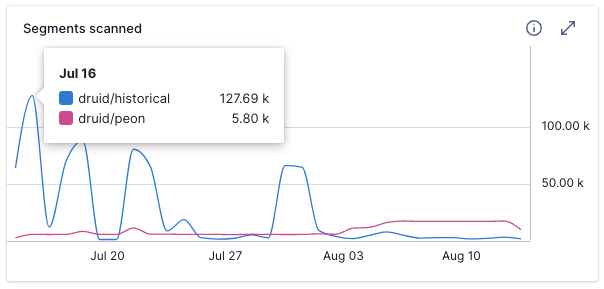
Segments scanned
Shows the number of segments scanned, grouped by node.
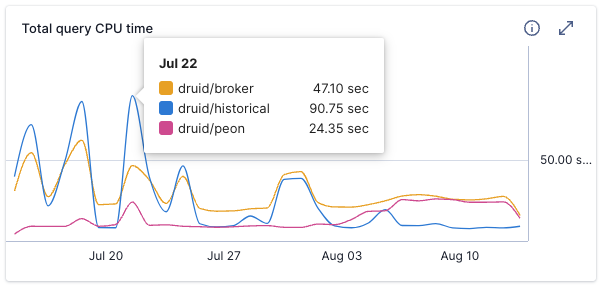
Total query CPU time
Shows the CPU time Polaris spent processing a query, in milliseconds, grouped by node.
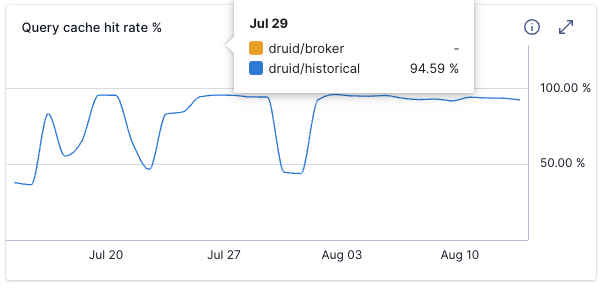
Query cache hit rate %
Shows the percentage of queries that hit the Polaris cache, grouped by node.
