Navigate the console
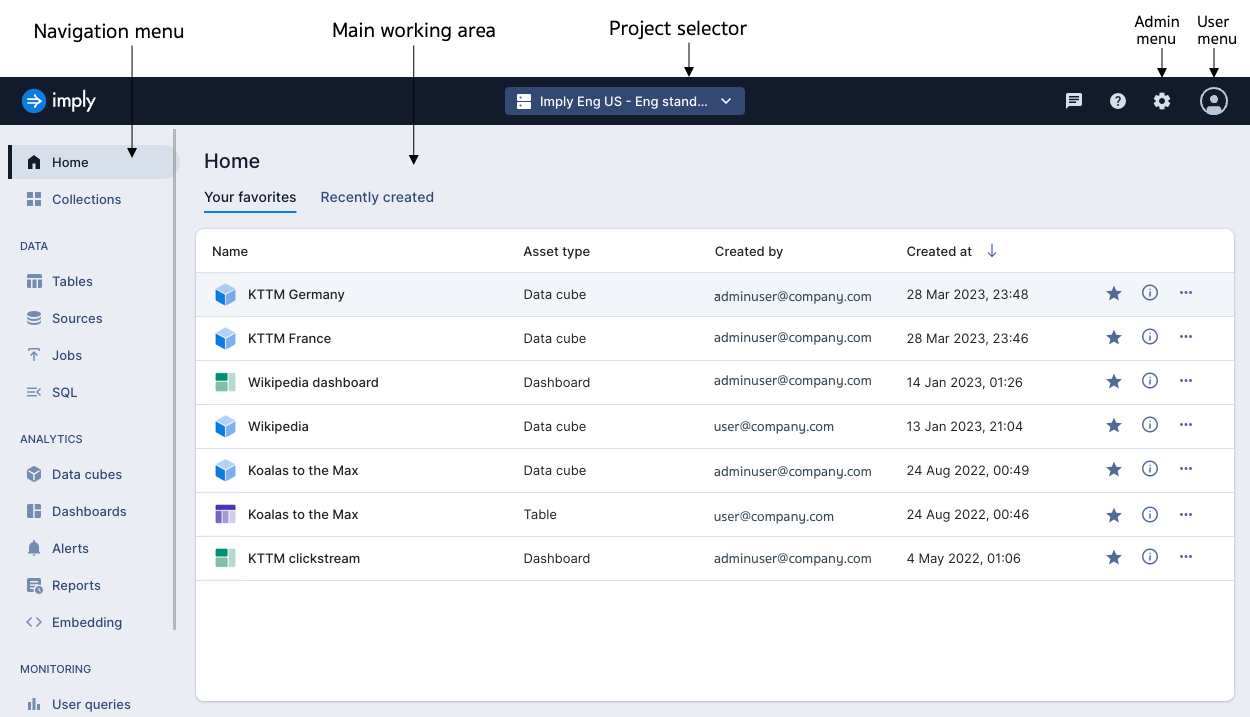
The Polaris console, often referred to as the Polaris user interface (UI), consists of three main sections:
- On the left is the navigation menu. It directs you to areas in the interface to analyze and view data, create and manage tables, and view storage information for your project.
- The main working area of the interface is in the middle. Polaris displays your favorites here when you access Home. If you have no favorites, you'll see recently created Polaris assets—alerts, dashboards, data cubes, embedding links, reports, and tables.
- The user menu, located in the top-right corner, contains your account information and operational resources.
Access to certain features is limited to users with specific permissions. If you are not able to view a certain tab, you may not have the necessary permissions to access that functionality. See Permissions reference for more information.
Navigation menu
Depending on your account permissions, the navigation menu can display analytics, data ingestion, monitoring, and management resources.
Continue reading for information about each resource.
Data
The Data section displays options for ingesting and organizing your data:
- Tables: Create, modify, and delete tables.
- Sources: Upload and delete files for batch ingestion. Manage ingestion sources.
- Jobs: Monitor jobs including batch and streaming ingestion, data deletion, and table deletion.
- SQL: Run SQL queries and examine query results.
Analytics
The Analytics section consists of the following visualization and analytics resources:
- Data cubes: Create and manage data cubes.
- Dashboards: Create and manage dashboards.
- Alerts: Set up alerts to monitor events in your data.
- Reports: Schedule reports that deliver select data to specified recipients.
- Embedding: Create embedding links to read-only visualizations.
Monitoring
The Monitoring section displays options for monitoring how your project is performing:
- User queries: View dashboards that report the health and performance of your queries.
- Streaming: View dashboards that report health and performance of event stream ingestion.
- Detailed metrics: A data cube interface where you can explore your Polaris metric data using a data cube interface.
For more details, see Use dashboards to monitor Polaris.
Project selector
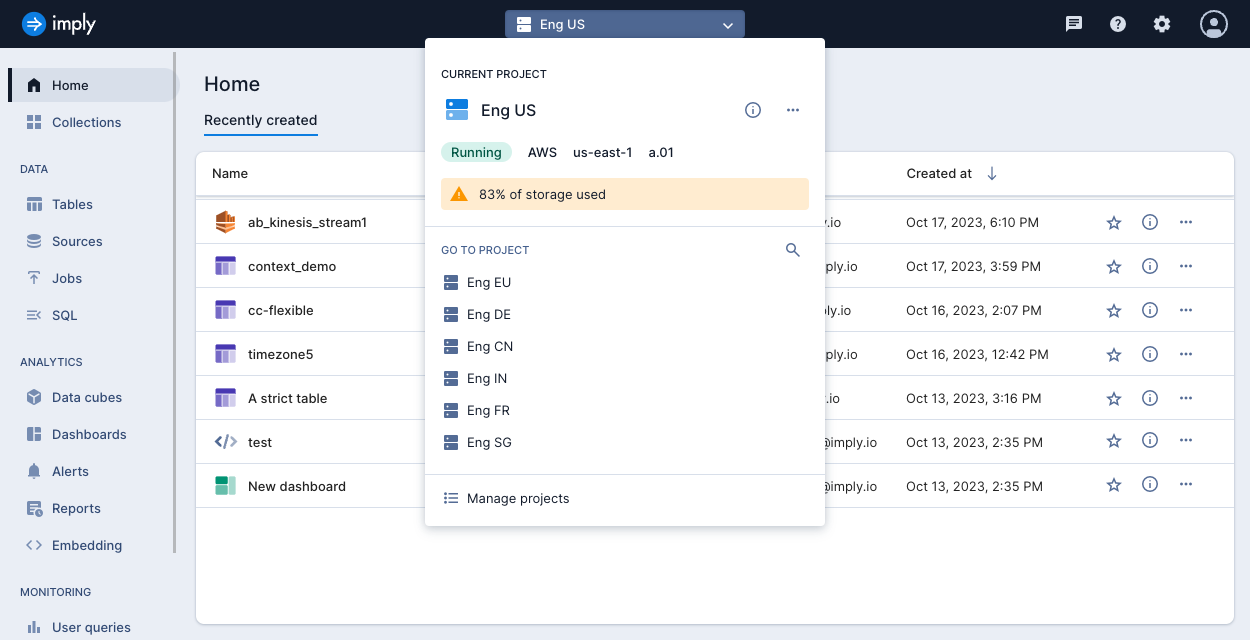
The project selector displays the details of your current project and allows you to switch across multiple projects. To view the details of your project, including the current Polaris version, expand the project selector drop-down and click the information icon next to the project's name.
The following screenshot shows the expanded project selector for an organization with multiple projects:
If you have two or more organizations, you must log into each organization separately.
Administration
Click the gear icon to access the Administration console. Depending on your account permissions, the Administration console can include the following options:
- Projects: Manage projects.
- Billing: View information about your payment plan and account usage.
- Customize: Manage customized logos, UI colors, and visualization colors.
- Users: Manage users.
- User groups: Manage user groups.
- Identity providers: Configure single sign-on using identity provider settings.
- API keys: Manage API keys.
- OAuth clients: Manage OAuth clients.
- Audit logs: View and export audit logs that track security events in Polaris.
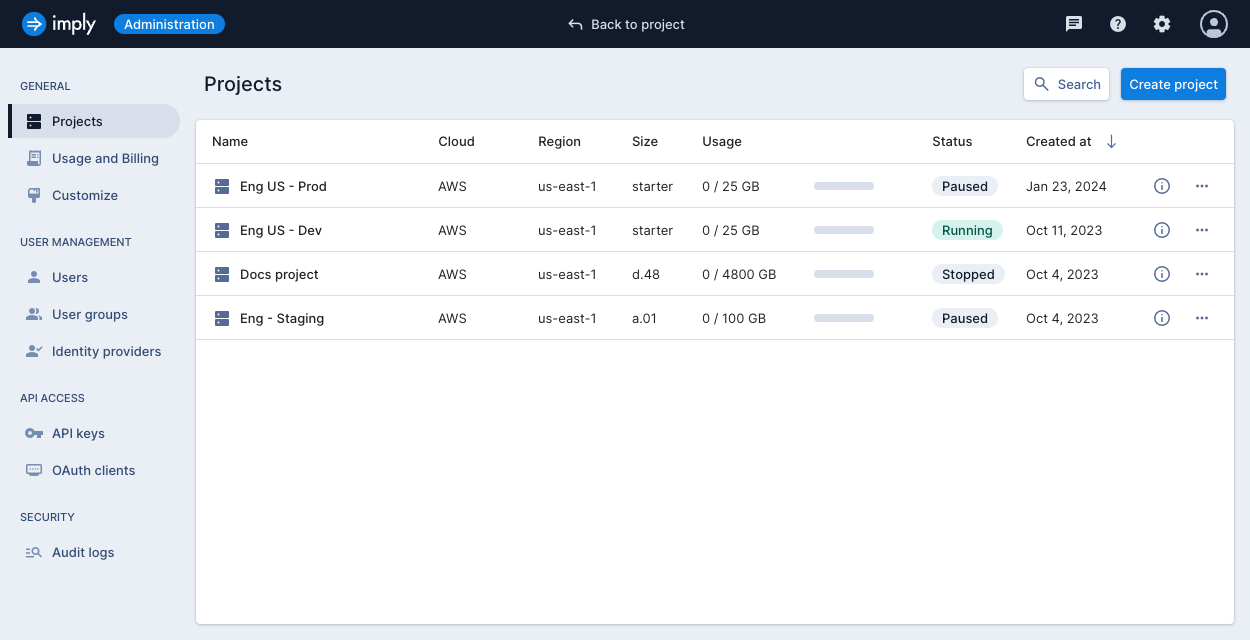
The following screenshot shows the Administration console:
User menu
Click the user profile icon to access the following user menu options:
- Your profile: View your account information and user groups.
- Support: View community discussion topics and submit feature requests.
- Sign out: Sign out of your account.
Collections and favorites
You can create collections and favorites to group Polaris assets together for easy access. Polaris assets are alerts, dashboards, data cubes, embedding links, reports, tables, and sources.
Collections
You can create a collection to group Polaris resources together—for example, assets that are relevant to a group of people or assets that relate to a particular data source.
Users with the ManageCollections permission assigned to their profile can create collections in Polaris. For information on permissions that control who can access and manage collections, see Permissions reference.
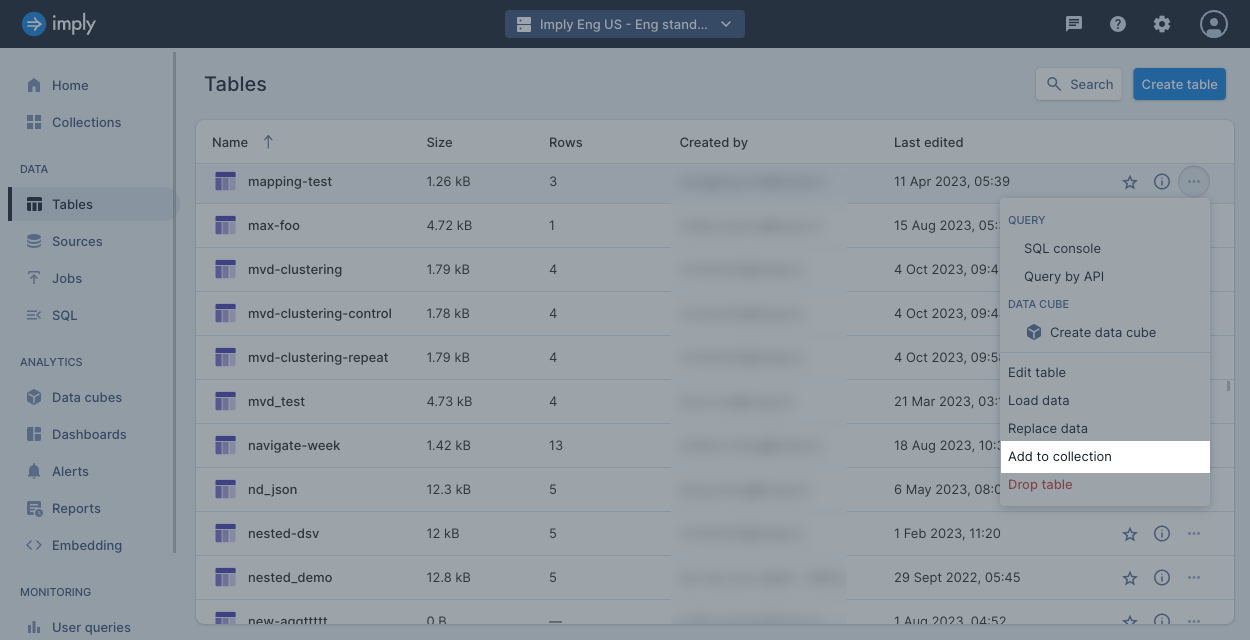
On the main page for any asset type, click the ellipsis on the right side of an asset's row and select Add to collection. The following screenshot shows this option for an individual table on the Tables page:
You can also add an asset to a collection from the options available on its own page.
Click Collections in the left navigation bar to view and manage collections.
Favorites
Your favorites are unique to you and can't be viewed by other users.
On the main page for any asset type, click the star icon on the right side of an asset's row to add it to your favorites.
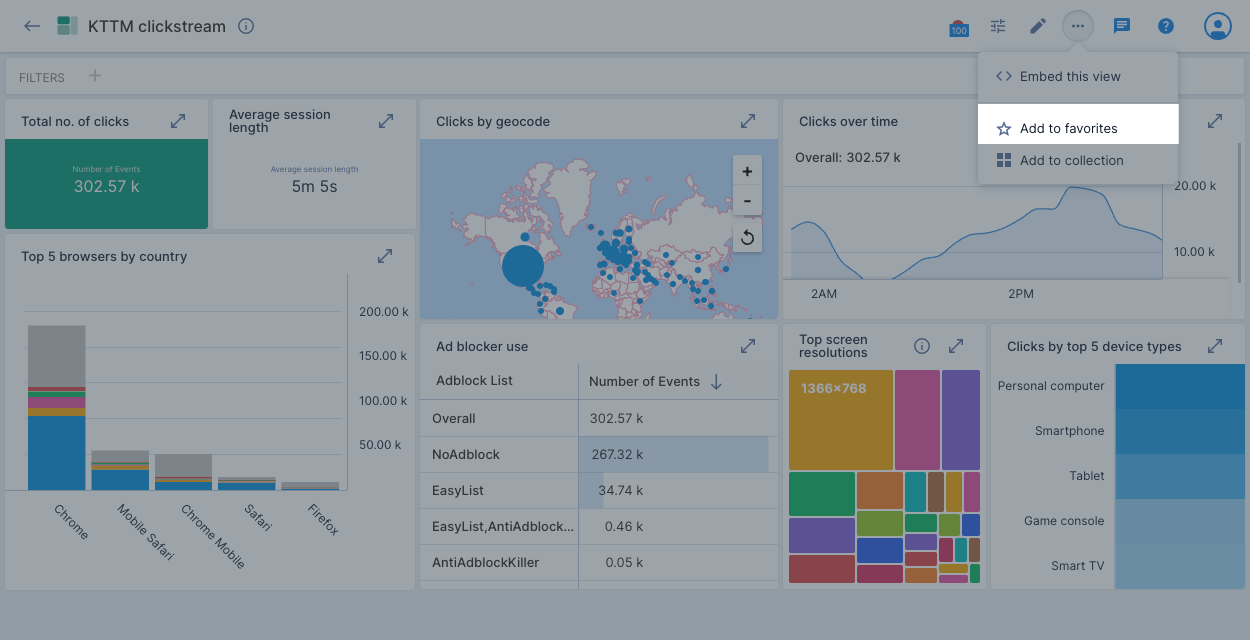
You can also add and remove an asset from your favorites from the options available on its own page. The following screenshot shows this option for the KTTM clickstream dashboard:
Click Home in the left navigation bar to view and manage your favorites.
Contact support
On any page in the Polaris UI, click the chat icon in the top right corner to access the live chat function.
You can chat to a member of Imply Support between 9 AM and 5 PM, Pacific Standard Time and Indian Standard Time. Outside these times you can complete the form and a member of the support team will get back to you.
Documentation
On any page in the Polaris UI, click the question mark icon in the top right corner to access technical documentation for Polaris.