Set up alerts
You can set up alerts for Imply Polaris to monitor events in your data. An alert monitors for when one or more measures match configurable conditions. You can choose how you want to be notified when an alert gets triggered, and set the recipients for these notifications.
Polaris uses the alert configuration to query the specified data cube and filter the data. It then evaluates your specified conditions against the query results, to determine when to trigger the alert.
Alerts are based on your own data—for example, you could trigger an alert when revenue drops by a specified percentage.
You can have a maximum of 100 active alerts in a project. If you restrict alert access to specific users, a user might encounter the alert limit even if they can't see all 100 active alerts.
Prerequisites
Users with AdministerAlerts or ManageAlerts permissions assigned to their profile can schedule alerts in Polaris. For information on permissions that control who can access and manage reports, see Permissions reference.
Users additionally need the ManageAlertsWebhooks permission to set up or modify webhooks for an alert.
Create an alert
Follow these steps to create an alert:
-
Click Alerts in the left pane, then click New alert:
You can also create an alert from a data cube. Click the Alerts and reports ellipsis in the top right corner of the page, then select Set up alert.
-
Configure alert options, then click Access options.
-
Manage access to the alert and then click Set up webhooks, or click Set up webhooks if you want to accept the access defaults.
-
Set up a webhook and then click Create alert, or click Create alert to save the alert without a webhook.
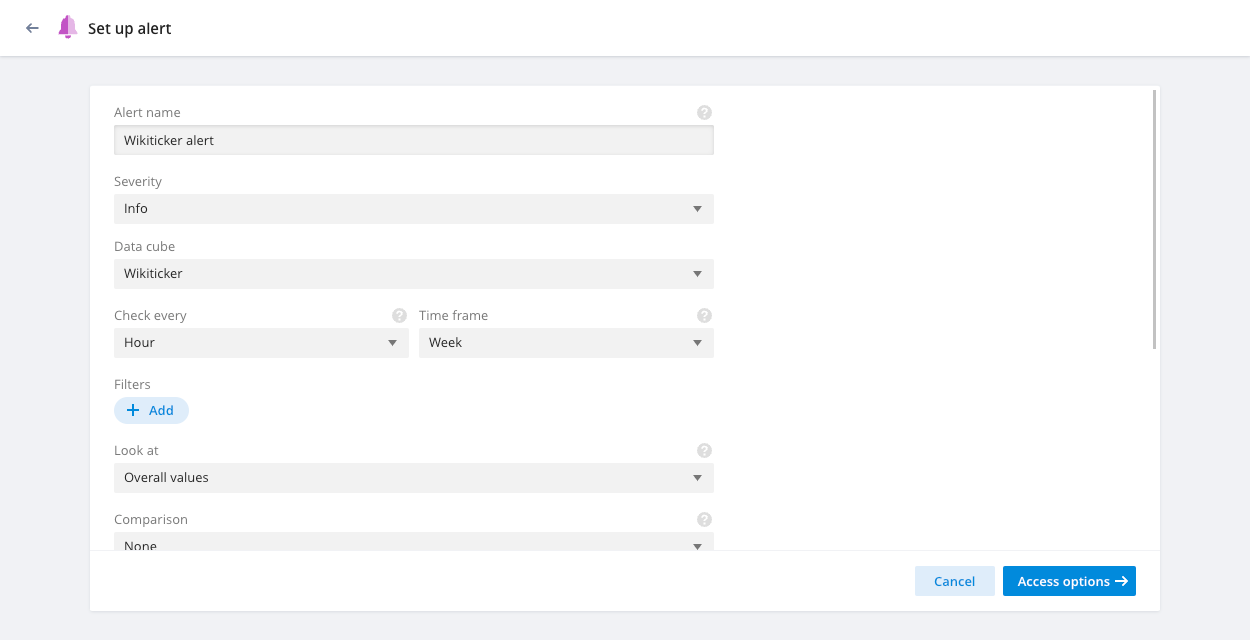
Configure alert options
The following table lists all of the options you can configure for an alert:
| Field | Description |
|---|---|
| Alert name | The name of the alert. The name appears on the Alerts page, and in emails and webhook notifications. |
| Severity | Select a severity from the following options: Info, Warning, Error, OK. The severity you select affects the alert's color and icon in the Polaris UI. |
| Data cube | Select the data cube that contains data you want the alert to monitor. |
| Check every | Defines how often Polaris evaluates alert criteria. You can select a predefined length of time—for example, Minute, Hour, Day—or enter a custom value. Polaris uses the ISO 8601 duration format to describe time intervals. For example, you can define a 12-hour period with the string PT12H or a 2-month period with the string P2M. You can restrict the options available to most users by setting a Minimum alert frequency in the data cube's properties. |
| Time frame | Controls the amount of data Polaris considers when evaluating the alert criteria based upon a time interval. Setting this field to Day, for instance, results in the alert querying data for the previous day (defined from the moment the alert is evaluated). It's best practice to make Time frame greater than or equal to Check every, so that your alert doesn't skip events. By default, Time frame and Check every are equal. You can restrict the options available to most users by setting a Minimum alert timeframe in the data cube's properties. |
| Start date | Date to start evaluating the alert. |
| Start time | Time to start evaluating the alert. |
| Latest data strategy override | Overrides the latest data strategy setting for the Data cube and determines how Polaris calculates the latest data time for the alert:
|
| Filters | You can define one or more filters to restrict the alert data Polaris gathers during alert evaluation. Select from the list of dimensions for your chosen data cube. Polaris then presents further options based on the dimension type, such as whether to include or exclude your chosen values. |
| Look at | Determines the data Polaris evaluates the alert criteria against.
|
| Comparison | Select a predefined comparison period, such as 1 week back or enter a custom value. |
| Conditions | Specify one or more conditions to trigger your alert. Click the All conditions or Any conditions tab to define whether all, or at least one, condition must be met.
|
Preview shows how many times the alert would have triggered based on existing data. The active alert may trigger more or less often depending on your live data. The actual frequency of minute-level alerts may be lower than projected due to real-world conditions.
Manage access
By default, all project users can view a newly created alert. The alert creator and users with the AdministerAlerts or ManageAlerts permission assigned to their profile can edit the alert.
You can configure access to an individual alert at a more granular level when you create or edit an alert:
- Click the Access tab.
- Click Add people.
- Select one or more users and groups from the drop-down lists for the following access levels:
- Can view: View the alert. Users with this access level also need the
AccessAlertspermission assigned to their profile. - Can edit: View and edit the alert. Users with this access level also need the
ManageAlertsorAdministerAlertspermission assigned to their profile.
-
Check the Email checkbox to send an email to the recipient each time the alert triggers. If you don't check the email box, recipients don’t receive an email notification but they can see the alert and its occurrences in the Polaris UI. See Example alert email for more information.
In cases where different permissions on the individual level and the group level apply to the same user, Polaris applies the most privileged permission. For example, if an individual user has Can view access to an alert, but they are a member of a group with Can edit access, they can edit the alert.
-
Optional: You can enter a comma-separated list of external email addresses to receive alert emails in the Webhooks configuration section.
Example alert email
Polaris sent the following example email when an alert was triggered:
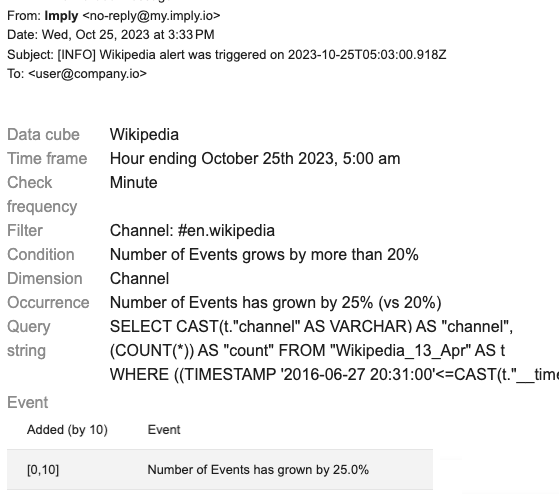
Polaris alert emails automatically include the X-Auto-Response-Suppress: All header to suppress replies to email messages.
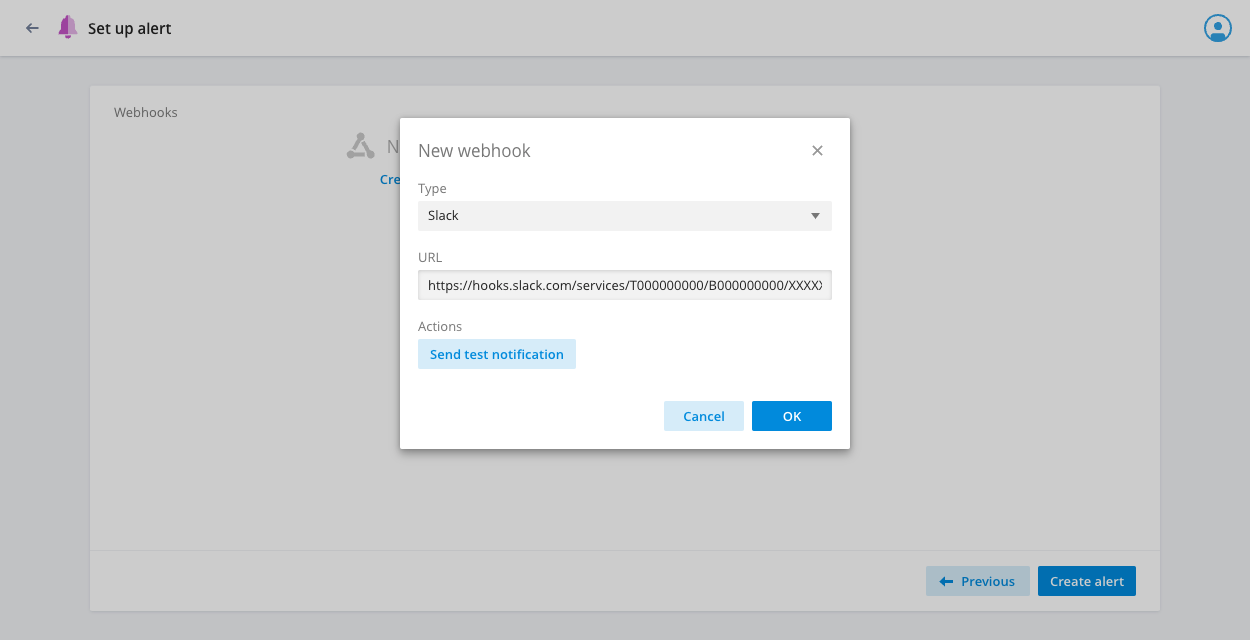
Set up a webhook
Webhooks enable notifications about triggered alerts by a third-party service. Polaris supports Slack and custom webhooks. You can set up a webhook when you create or edit an alert.
To set up or modify an alert's webhooks, you need the ManageAlertsWebhooks permission assigned to your user profile.
Webhook properties
You can define the following properties in an alert webhook:
title: Name of the alert.triggerDate: Date and time at which the alert triggered.checkFrequency: Frequency of the alert at the time it triggered.timeFrame: Period of time the alert covers.severity: Severity level of the alert.color: Color associated with the alert's severity level, expressed as an HTML color code.link: Link to a data cube showing the alert criteria at the time the alert triggered.summary: Summary of the alert details as a single string.summaryData: Summary of the alert details as an array ofalertEvaluationSummaryDataobjects containing:summary: Description of the alert evaluation.currentValue: Value that triggered the alert.previousValue: Value from the previoustimeFrame—used indeltaandpercent-deltacalculations.rawDelta: Difference betweencurrentValueandpreviousValue.percentDelta: Percentage change between the current and previous values, if there is a previous value.dimensionName: Column name from the table if the alert is configured to look at dimension values.dimensionValue: Row value that triggered the alert if the alert is configured to look at dimension values.measureTitle: Name of the measure that triggered the alert.conditionTriggerValue: Value used by the condition to check againstcurrentValue.type:valuefor evaluation against an absolute value,deltafor evaluation against a change in the absolute value, orpercent-deltafor evaluation against a percentage change in the measure value.condition:lessThanorgreaterThanto indicate if the alert triggered when the measure value was less than or greater than the expected value.triggered: Boolean flag to indicate whether the evaluation was triggered.
footer: Optional footer, intended for use in Slack integrations.
Configure a Slack webhook
You can configure a Slack webhook with a predefined payload or configure a custom payload. To customize the payload for a webhook, follow the steps in Configure a custom webhook.
Use the predefined payload
Follow these steps to create a Slack webhook URL for Polaris alerts with a predefined payload:
-
Follow steps 1-3 of the Getting started with incoming webhooks Slack doc to generate a webhook URL.
-
In your alert configuration, click Create one in the Webhook section and select Slack as the Type.
-
Copy and paste your Slack webhook URL into the URL field:
-
Click Send test notification to test the connection, then click OK to save.
The default Slack payload is as follows:
{
  "attachments": [
    {
      "fallback": "%title%",
      "color": "%color%",
      "title": "%title%",
      "title_link": "%link%",
      "text": "%summary%",
      "ts": "%triggerDate%"
    }
  ]
}
Configure a custom webhook
Follow these steps to create a custom webhook for a Polaris alert:
- In your alert configuration, click Create one in the Webhook section and select Custom as the Type.
- Enter your webhook integration URL in the URL field (you must generate this in your third-party application).
- If you want to use an Authorization Header, check the box and enter your authorization string. Polaris outputs the header in the following format:
Authorization: [your webhook auth header definition] - Modify the payload as required. See the webhook properties and example payload below.
- Click Send test notification to test the connection, then click OK to save.
Example custom webhook
An example custom webhook payload is as follows:
{
  "attachments": [
    {
      "fallback": "\"Wikipedia\" alert was triggered",
      "color": "#038ADC",
      "title": "\"Wikipedia\" was triggered",
      "title_link": "/pivot/d/6e7aacc0d0cf2644d8/Wikipedia",
      "text": "Hourly Wikipedia alert",
      "summaryData": [{"summary":"Hourly Wikipedia alert","currentValue":"2","previousValue":"1","rawDelta":"1","percentDelta":"100%","measureTitle":"Number of Events","conditionTriggerValue":1,"type":"percent-delta","condition":"greaterThan","triggered":true}],
      "ts": 1683557493,
      "footer": "Sent by Imply",
      "footer_icon": "https://example.imply.io/favicon/my-icon.png",
      "checkFrequency": "Hour",
      "timeFrame": "Hour ending at May 8th 2024, 2:51 pm"
    }
  ]
}
Manage alerts
You can click the ellipsis to the right of the alert name on the Alerts page to manage an alert.
Select the corresponding option to edit, duplicate, or delete the alert, toggle its active status, or add the alert to a collection. Click the star icon on the right side of the alert's row to add it to your favorites.
View alert history
Click Alerts in the left pane to view the alerts page, and click the name of an alert to view its history page.
The history page shows when the alert was triggered, alert conditions, and the value of the data. You can also analyze the alert data in a data cube.
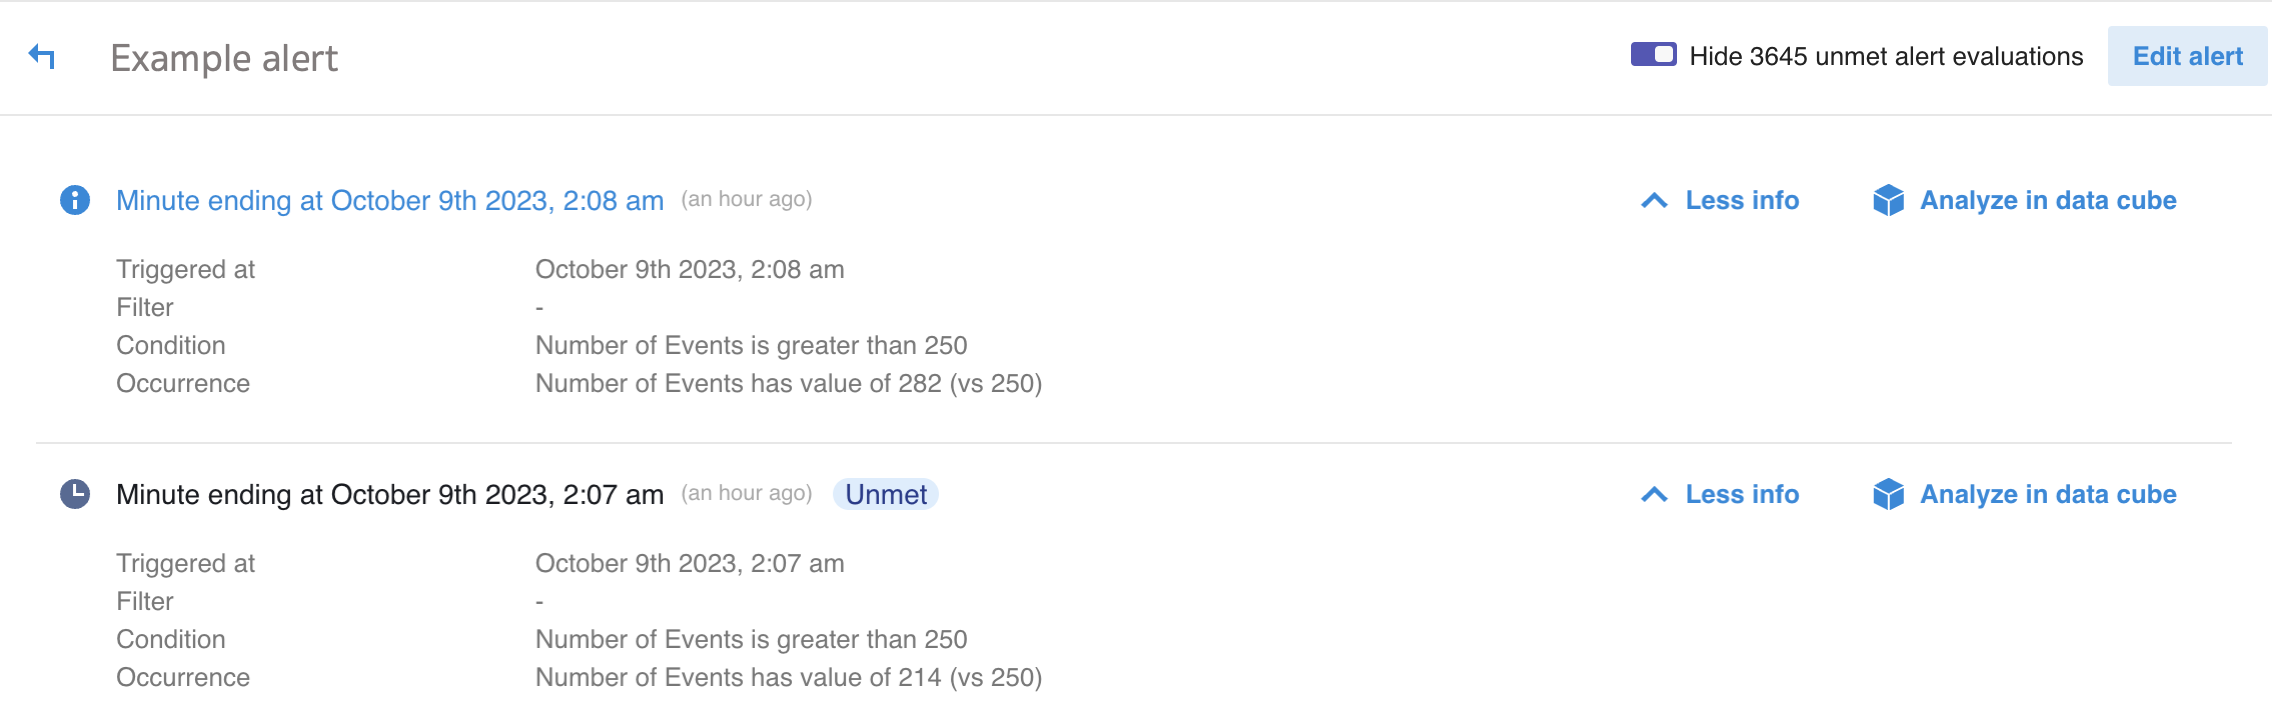
Unmet evaluations
You can view the history of times Polaris evaluated alert criteria but didn't trigger the alert because not all criteria were met.
Before you can view unmet evaluations, Imply must enable the feature for you. Contact Polaris support to request the feature.
Click Show x unmet alert evaluations on an alert's history page and click More info next to an unmet evaluation.
The following example shows that Example alert triggered at 2.08 AM. The number of events was 282 which met the alert criteria of more than 250 events. The alert was also evaluated at 2.07 AM but the number of events was 214 so the alert wasn't triggered.
Troubleshoot alerts
A high volume of notifications can cause links in alert emails and webhooks to stop working. If this happens, contact Imply support.
Learn more
See the following topics for more information:
- Manage data cubes for creating and editing data cubes.
- Visualize data for using Polaris visualization features to draw insights from your data.
- Set up reports for scheduling reports based on your data.