Estimate distributions with quantile sketches
Quantile sketches are mergeable streaming algorithms that let you estimate the distribution of values in a stream, such as the 25th percentile value, the median value, and the 75th percentile value.
Imply Polaris supports the Quantiles sketch developed by the Apache DataSketches library of stochastic streaming algorithms. The Quantiles sketch lets you characterize the distribution of numeric values in a stream. It provides approximate answers with a well defined error bound independent of the distribution of values.
This topic shows you how to ingest data as Quantiles sketches and query the sketched data.
All examples are based on the data in the shows.csv dataset.
Create a Quantiles sketch
Polaris uses the DS_QUANTILES_SKETCH function to create Quantiles sketches from raw numeric data during ingestion.
| Function | Description |
|---|---|
DS_QUANTILES_SKETCH(expr, [k]) | Creates a Quantiles sketch on the values of expr, which can be a regular column or a column containing Quantiles sketches. The k parameter determines the accuracy and size of the sketch. See Accuracy and size for more information. |
Ingest pre-computed sketches
To ingest a pre-computed Quantiles sketch, use the DECODE_BASE64_COMPLEX(dataType, expr) function with the DS_QUANTILES_SKETCH creation function.
For example, the following input expression ingests pre-computed Quantiles sketches from the input field named quantiles_input:
DS_QUANTILES_SKETCH(DECODE_BASE64_COMPLEX('quantilesDoublesSketch', "quantiles_input"))
For more information about the DECODE_BASE64_COMPLEX function, see Ingest pre-computed data sketches.
Example
Consider a use case in which you want to calculate arbitrary quantiles of the distribution of values from a stream of web page time-spent events.
To do this, you need to create a measure in an aggregate table and enter the DS_QUANTILES_SKETCH function in the input expression for the measure.
Follow these steps to create Quantiles sketches using the numeric data in shows.csv:
-
Upload the
shows.csvfile to the file staging area. -
Create an aggregate table. The Polaris table schema only accepts sketch columns as measures.
-
On the Map source to table page, where you map input fields to table columns, click the plus icon to add a new measure.
-
In the Measure details dialog, enter the column information:
- Name: The column name. For example:
quantiles_minutes_watched. - Data type: The Quantiles sketch data type.
- Input expression: The
DS_QUANTILES_SKETCH(expr, [k])function. For example:DS_QUANTILES_SKETCH("minutes_watched", 128).
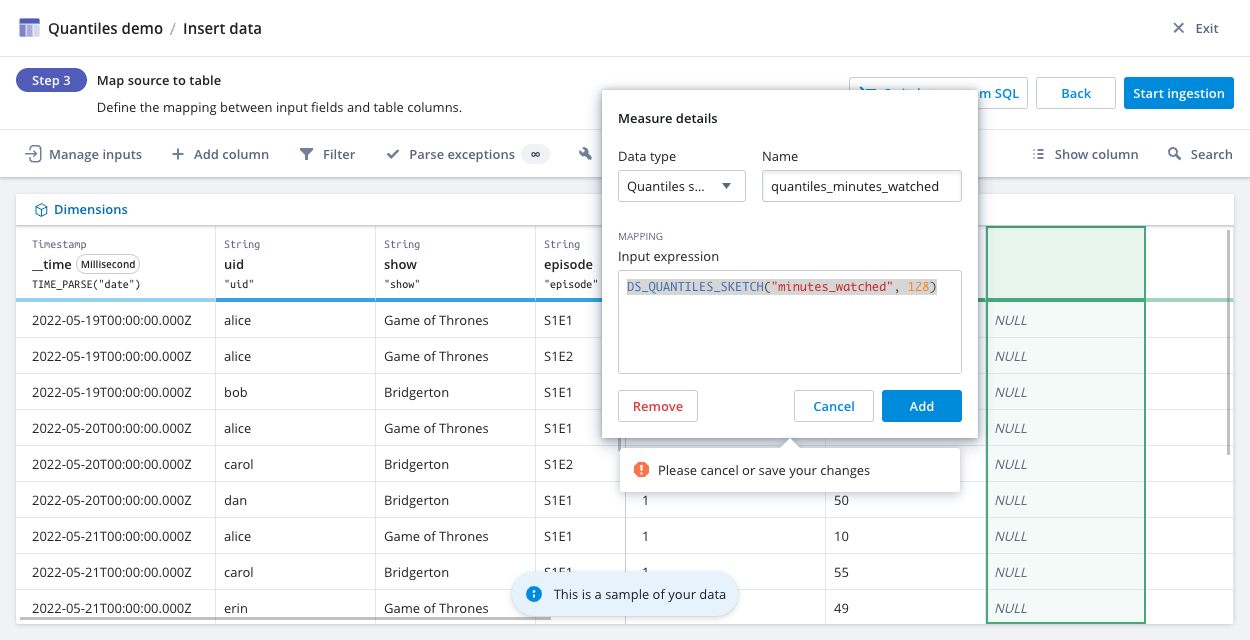
- Name: The column name. For example:
-
Click Add.
-
Click Start ingestion.
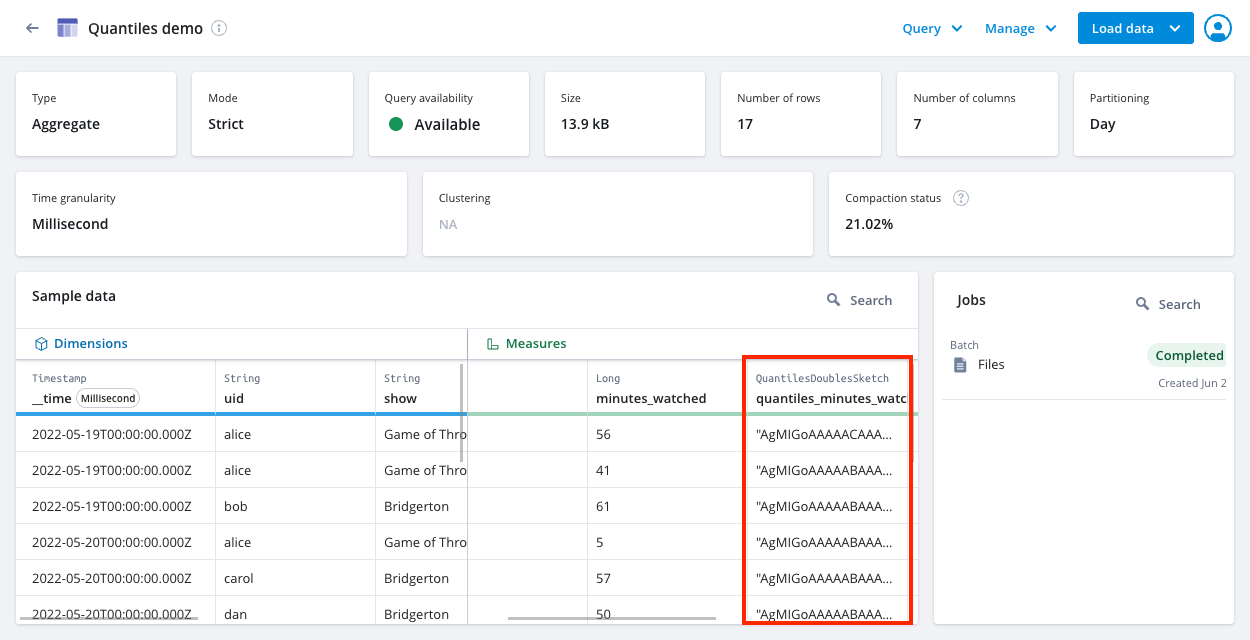
The following screenshot shows an aggregate table named Quantiles demo with the quantiles_minutes_watched column after ingestion. Note that Polaris displays sketches as Base64-encoded strings.
Query sketched data
In the Polaris UI, you use the SQL console to query data. To access the SQL console, go to the Table detail page and click Query > SQL console.
Polaris uses the APPROX_QUANTILE_DS function to compute approximate quantiles on numeric or Quantiles sketch expressions.
| Function | Description |
|---|---|
APPROX_QUANTILE_DS(expr, probability, [k]) | Computes approximate quantiles on numeric or Quantiles sketch expressions. Enter a probability value between 0 and 1, exclusive. The k parameter determines the accuracy and size of the sketch. See Accuracy and size for more information. |
Example
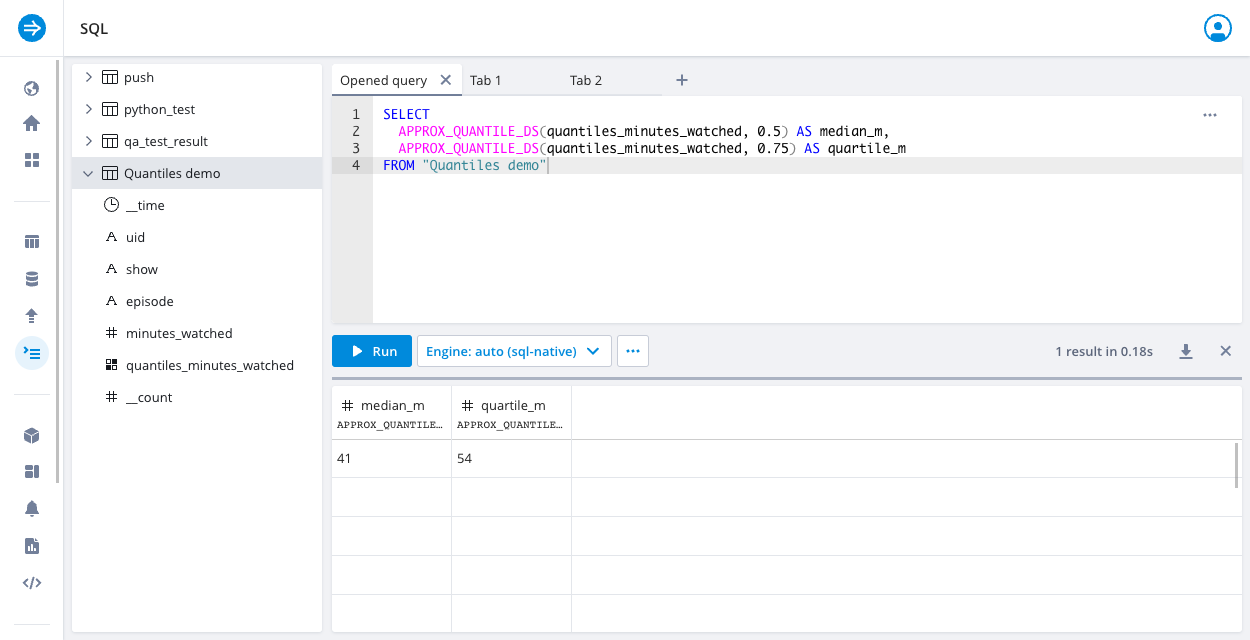
The following sample query computes the median (k=0.5) and the third quartile (k=0.75) of minutes watched:
SELECT
  APPROX_QUANTILE_DS(quantiles_minutes_watched, 0.5) AS median_m,
  APPROX_QUANTILE_DS(quantiles_minutes_watched, 0.75) AS quartile_m
FROM "Quantiles demo"
Accuracy and size
The value of k determines the accuracy and overall size of the Quantiles sketch.
See the DataSketches Quantiles sketches accuracy and size document for more information.
Keep the following in mind when using DS_QUANTILES_SKETCH and APPROX_QUANTILE_DS functions:
- Higher
kmeans higher accuracy but more space to store sketches. The value must be a power of 2 from 2 to 32768. - If not specified,
kdefaults to 128.kof 128 produces a normalized rank error of 1.725%. See the DataSketches Sketching Quantiles and Ranks tutorial for more information.
Learn more
See the following topics for more information:
- Create an ingestion job for mapping and transforming ingestion-time input data with input expressions.
- Ingest and query sketches by API for ingesting and querying sketches programmatically.
- Quantiles sketch functions for functions that operate on the Quantiles sketch.