Analytics overview
The Quickstart introduces you to visualization features in Imply Polaris. If you are new to Polaris, we recommend you begin there. This topic takes a deeper look at the visualization features, including data cubes and dashboards.
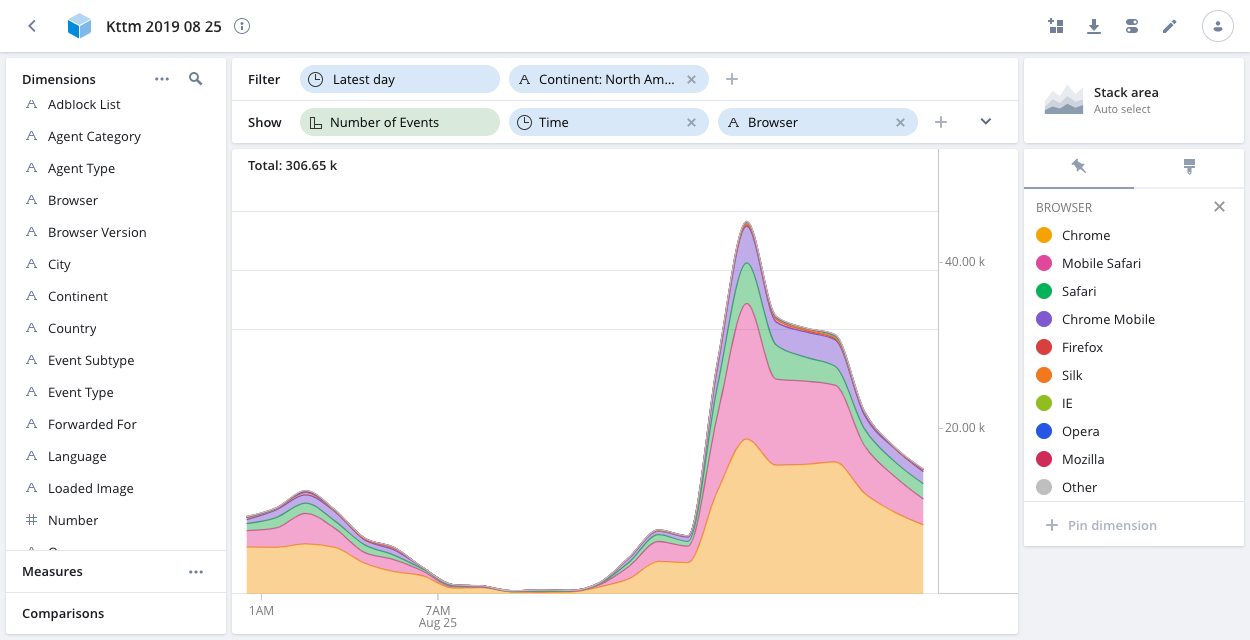
Polaris democratizes data analytics, giving anyone in an organization the ability to explore and analyze data with visually rich, easy-to-use tools. These tools include dashboards, query builders, and data cubes, such as the following data cube:
Data cubes provide a framework for users to explore data. Typically, someone in the organization with substantial knowledge of the data set, such as a data analyst, sets up the data cubes and dashboards.
Data analysts should ensure that the underlying queries that compose the data cube yield results relevant to the organization use cases. Data cubes also form the basis for dashboards. So similarly, when designing a set of data cubes, data managers should take into consideration the types of dashboards data users will use. While data cubes provide an exploratory interface for a data set, dashboards provide a high-level, comprehensive view of the state of the data.
Learn more
See the following topics to get started with Visualize features:
- Manage data cubes: Create and edit data cubes.
- Visualize data: Learn about using visualization features to explore and draw insights from your data.
- Data cube dimensions: Learn about dimension types and create a custom dimension.
- Data cube measures: Create and configure measures, and view custom measure examples.
- Dashboards overview: Create and edit dashboards.
- Visualizations reference: Learn about visualization types.
- Set up alerts: Configure alerts to track events in your data.