CrossTab (deprecated)
The CrossTab view is deprecated. Please use Pivot 2.0 instead. Pivot 2.0 incorporates the capabilities of CrossTab view.
The CrossTab view is a data visualization mode in Pivot that gives you a pivot table-like view of your data.
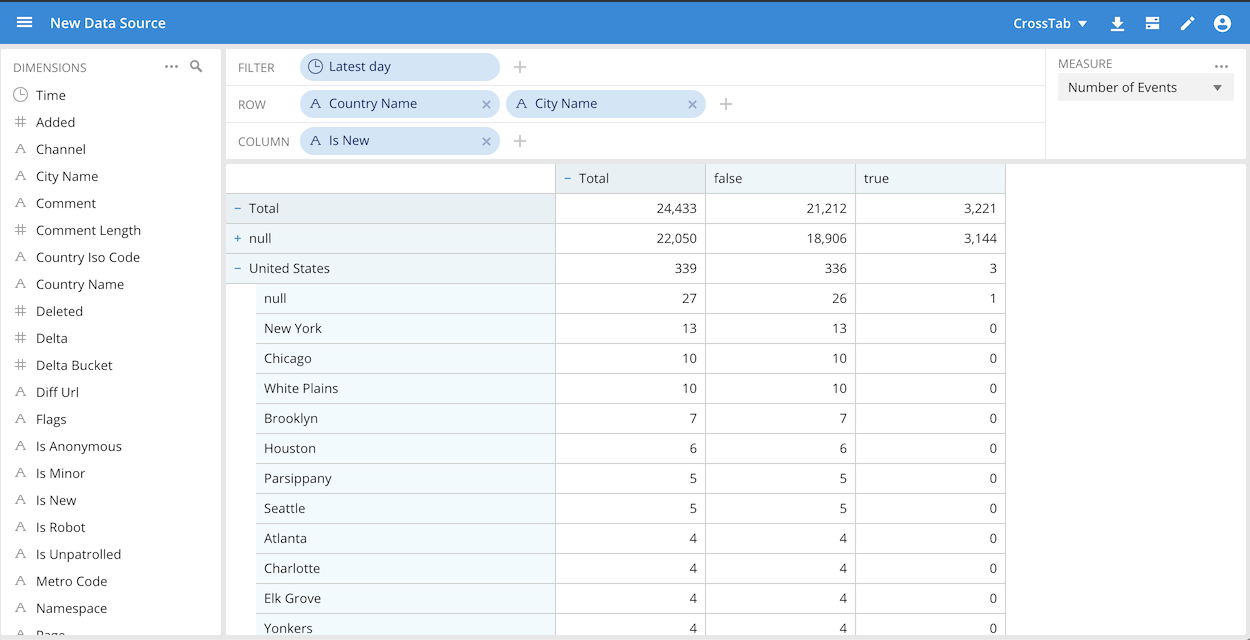
CrossTab makes data easier to analyze and understand by allowing you to aggregate data on multiple dimensions, such as Wikipedia edit data by Country Name and City Name in the following figure.

Further, by adding dimensions as columns, you can view measure data by individual dimension values.
To use CrossTab view:
Enable CrossTab from the Feature flags tab in Settings. See Feature Flags for more information.
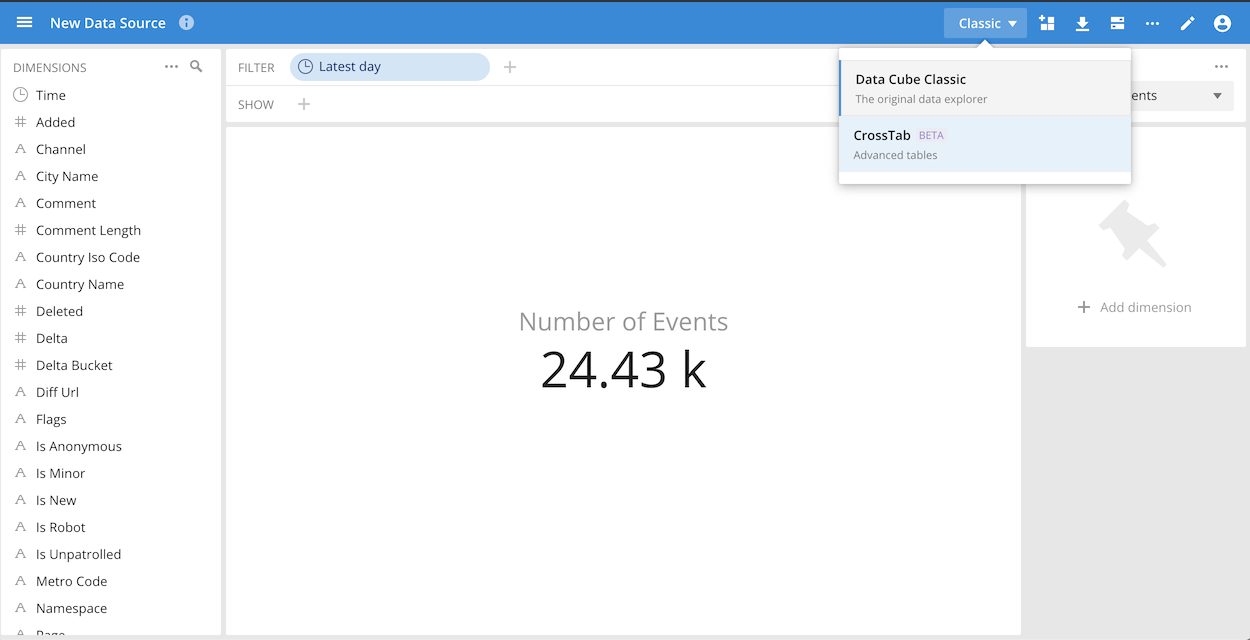
In the data cube, choose CrossTab from data view options menu:

You can then drag and drop dimensions to Rows and Columns.
To exit CrossTab view, choose Data Cube Classic from the data view options menu.