Annotations (alpha)
Event annotations are an alpha feature that should be considered preview and subject to change or removal at any time. Alpha features are provided "as is," and are not subject to Imply SLAs.
Event annotations allow Pivot users to mark and annotate ranges in timeline-based data cubes. They let you associate data in the timeline with significant events, such as a marketing campaign or a software version upgrade, and document those events for other Pivot users.
An event annotation is visible to any other Pivot user who has access to the data cube.
By default, event annotations are disabled. To enable them, enable the preview features flag in the Advanced administration page in the Pivot UI.
An annotation typically applies to a time range, but it can also apply to a single point in the timeline by making the start and end times the same. Note however that such single-point-in-time annotations can only be created and retrieved via the Event Annotation API; they are not visible in the UI.
From the data cube settings (accessible from the more options menu at the top right of the data field), viewers can choose to show or hide event annotations in a data cube.
Working with event annotations
There are two ways to add and view annotations, in the Pivot UI and using an API.
Working with annotations in the Pivot UI
Select a range in the timeline, click the more options icon, and then click Add annotation.
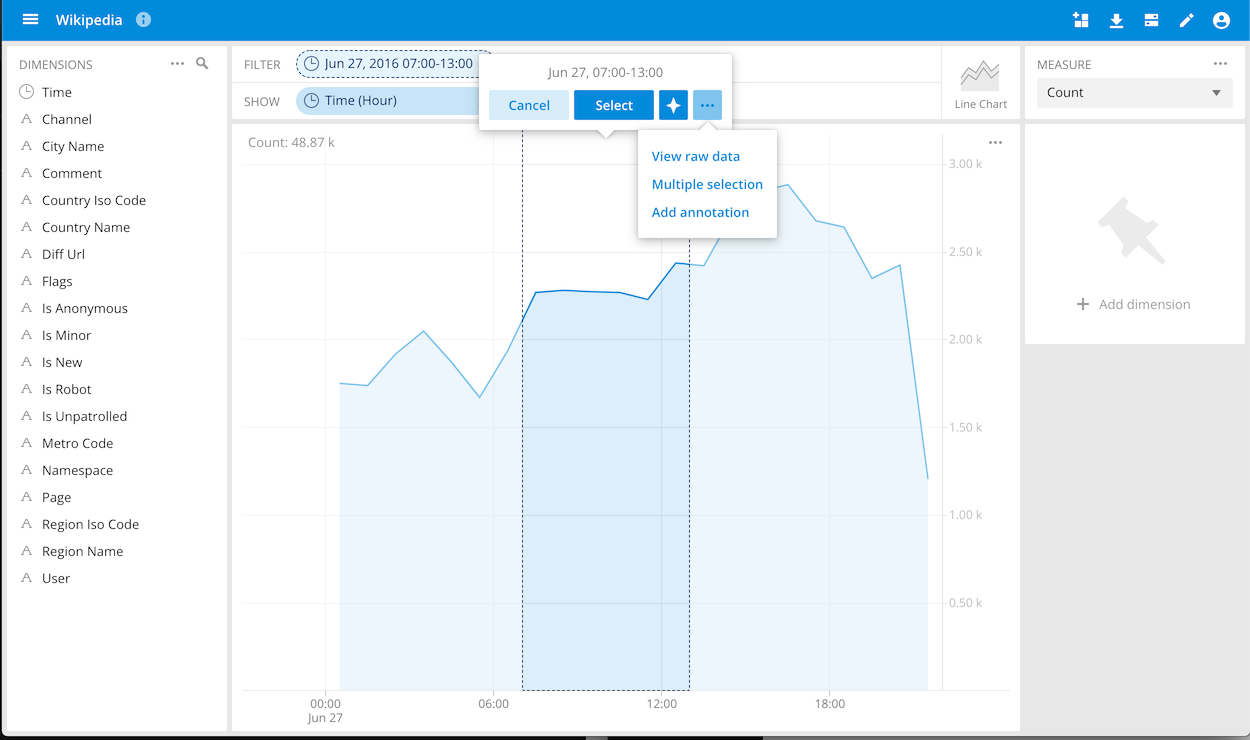
Add a note in markdown format.
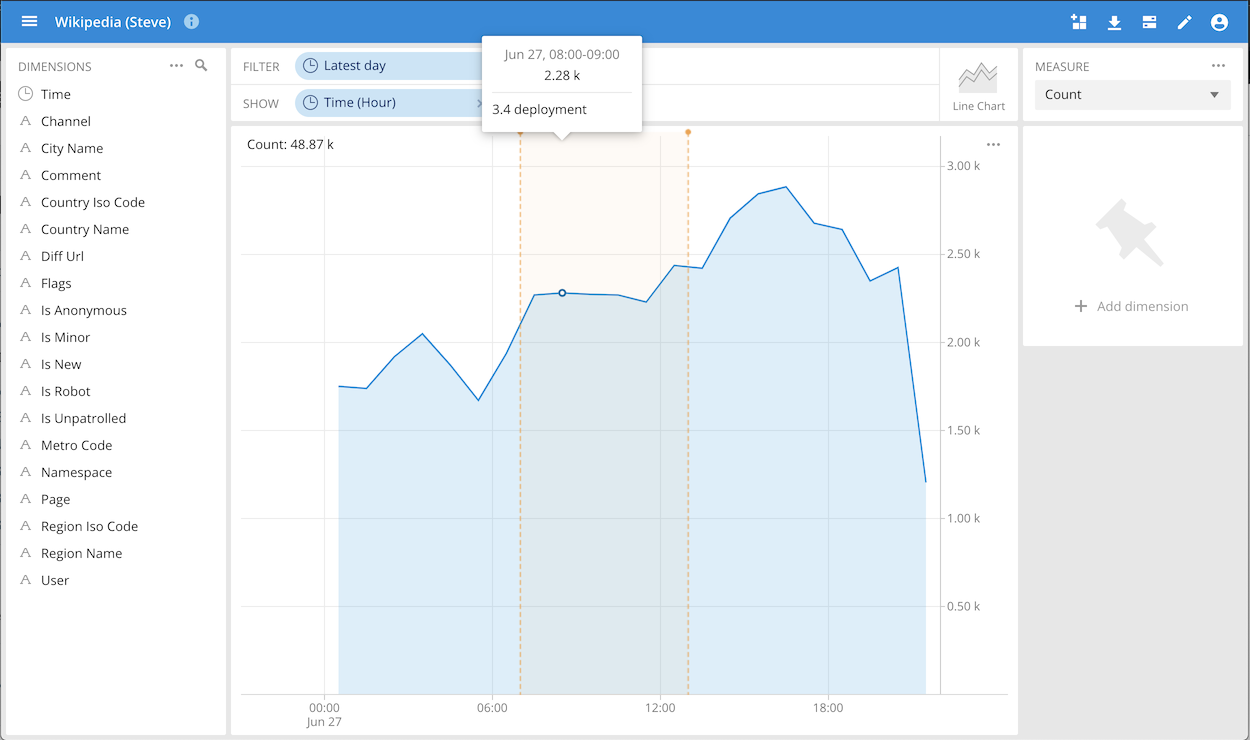
You can add or view annotations on time series line charts and area stacks. Hovering the mouse over a highlighted area will reveal the annotation contents. Visibility of annotations is not restricted by user permissions.
Remove an annotation by selecting inside the annotation time range, opening the more options menu again, and selecting Remove annotation from the menu. Edit permissions on the data cube are required to remove annotations.
Working with event annotations by API
You can view, create, and remove annotations via the Pivot API as described below.
As an API for an alpha feature, the following API should be considered unstable and subject to change.
| Methods | event-annotations | event-annotations/:name |
|---|---|---|
| GET | Returns all annotations | Returns the named annotation, or 500 if the annotation doesn't exist |
| POST | Creates a new annotation based on the payload ({eventAnnotation: EventAnnotationJS}) | Updates an existing annotation based on the payload ({eventAnnotation: EventAnnotationJS}), or throws a 400 if the annotation doesn't exist or if the given name doesn't match the payload's name. |
| DELETE | Error 404 (deleting an entire collection isn't allowed) | Deletes an annotation based on the passed in name, or returns a 400 response if the annotation doesn't exist. |
Example cURL request
curl -X POST --header "Content-Type:application/json" --header "x-imply-api-token:2e7db1ef-4bce-4330-83eb-e01941014656" --data '
{
 "eventAnnotation": {
 "name": "000",
 "body": "Some content",
 "start": "2020-05-28T01:26:03.412Z",
 "end": "2020-05-28T03:26:03.412Z",
 "creationDate": "2020-05-26T11:26:03.412Z",
 "dataCube": "4d78_54",
 "creator": "some-user-id",
 "color": "#456724",
 "editor": "some-other-user-id",
 "editionDate": "2020-06-15T09:29:57.606Z"
 }
}
' localhost:9095/api/v1/event-annotations
eventAnnotation Values
The eventAnnotation parameters are:
- name: A unique name for the annotation.
- body: Markdown content that can be used to document the annotation.
- start: The start time of the annotation range, in the format
YYYY-MM-DDThh:mm:ssTZD, such as2020-05-28T01:26:03.412Z. This can also be a number, for line charts with a numeric x-axis. - end: The end time of the annotation range, in the format
YYYY-MM-DDThh:mm:ssTZD. This can also be a number, for line-charts with numeric x-axis. - creationDate: The date the annotation was created.
- dataCube: The ID of the data cube, discoverable by API or via the UI as visible in the data cube URL.
- creator: The user ID of the annotation creator.
- color: The color of the annotation range in the UI, as a hexadecimal number; optional, and not editable in the UI.
- editor: The last user who modified the annotation. This is optional, and not editable or surfaced in the UI.
- editionDate: A date that represents the origination date of the current version of the annotation. This is optional, and not editable or surfaced in the UI.