Filtering by measures and dimensions
Filtering a data cube by a dimension works quite differently to filtering by a measure.
Filter by dimension
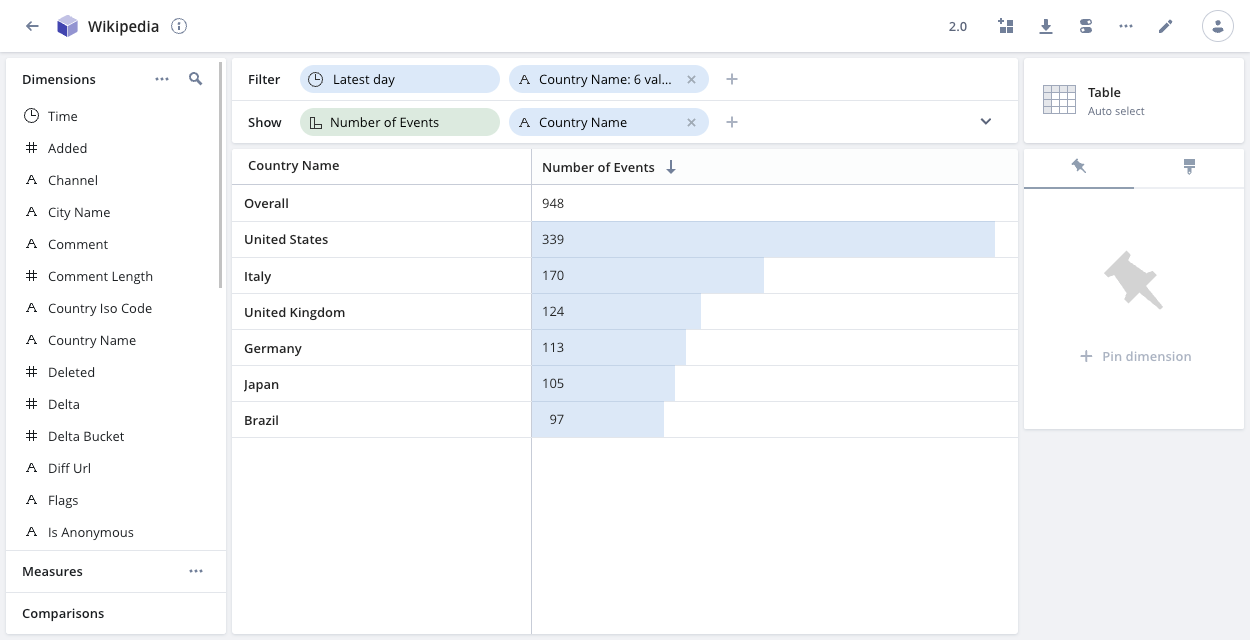
Filtering by dimension is equivalent to applying a WHERE clause in SQL. Pivot selects rows that satisfy the filter and removes rows that don't match the filter from the data set.
In the following example the Wikipedia data cube is filtered by the Country Name dimension. Pivot displays the number of events for each of the six selected country names, as well as the Overall (total) value.
Filter by measure
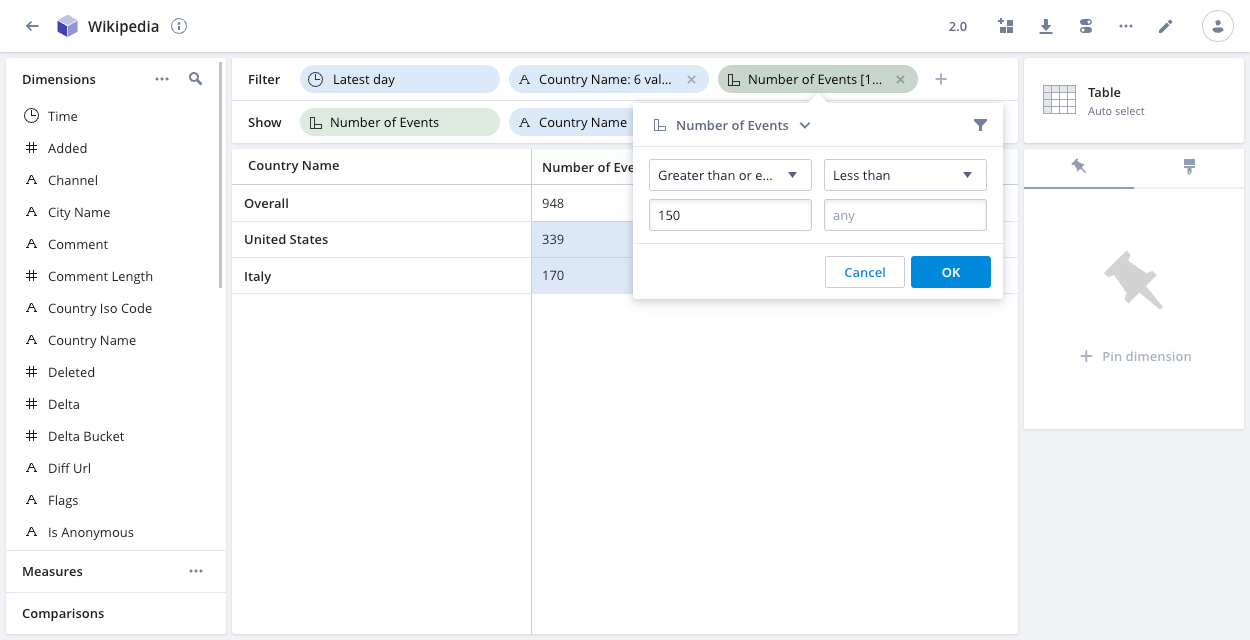
Filtering by a measure is equivalent to applying a HAVING clause in SQL. Pivot applies the filter after grouping the results.
The following example shows the Filter by dimension example but with an additional filter applied—the Number of Events measure. Pivot groups the data by Country Name and then applies the measure filter, to restrict the results to countries with number of events greater than or equal to 150. Only United States and Italy meet the criteria.
Most Pivot visualizations require continuous data, so they aren't compatible with filters by measure. For example, a line chart must contain a continuous dimension such as Time as the line.
Relative time filters
By default, relative time filters are inclusive of the start bound and exclusive of the end bound. For example, a filter on March 16 3-4 PM includes the following range by default:
2023-03-16T15:00:00.000Z - 2023-03-16T15:59:59.000Z.
You can override the default in a data cube, in a dashboard, and in individual dashboard tiles. The following screenshot shows the setting when applying a time filter to a data cube:
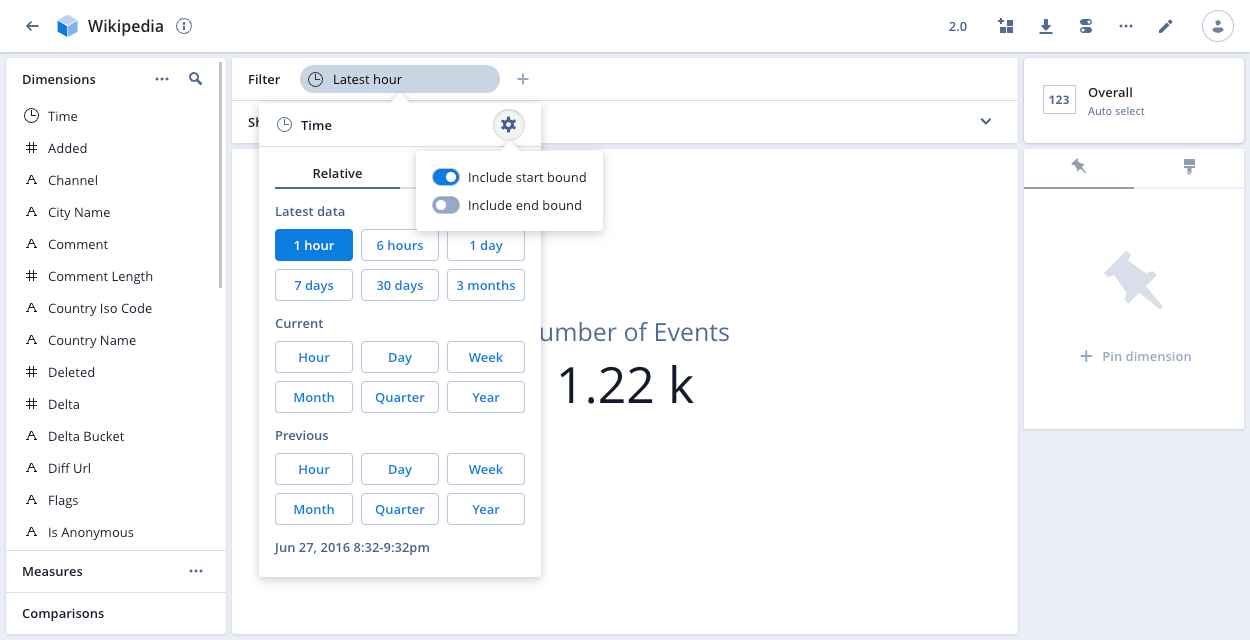
You can include or exclude the start and end bounds of the filter.
More information
For more information, see:
- About data cubes for more on filters, dimensions and measures.
- Dimensions for details on dimension types and creating custom dimensions.
- Measures for details on creating and configuring measures.