Design
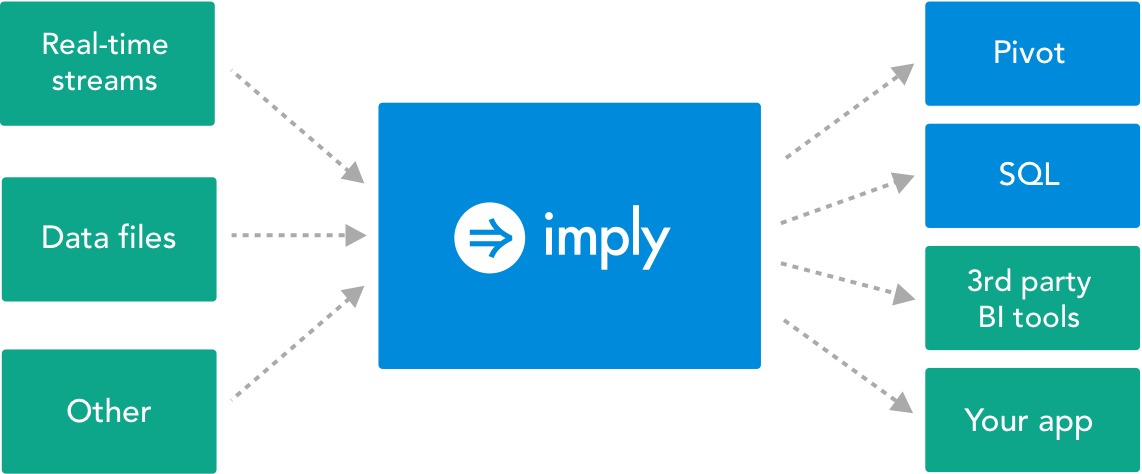
At a high level, Imply is an integrated solution that consists of a powerful analytics engine (Druid) and a collaborative app designed for arbitrary drill downs (Pivot).
Components
Druid
Druid is the open source analytics data store at the core of the Imply platform. Druid enables arbitrary data exploration, low latency data ingestion, and fast aggregations at scale. Druid can scale to store trillions of events and ingest millions of events per second. Druid is best used to power user-facing data applications.
For more information about Druid, see https://druid.apache.org/.
Pivot
Pivot is a web-based app for visual data exploration. It features dimensional pivoting, slice-and-dice and nested visualizations, as well as contextual information and navigation. It is used to perform OLAP operations with your data and immediately visualize your data once it is loaded in the platform.
Clarity
Clarity is a dev ops and performance analytics tool that connects to your Imply Cluster. Explore anomalies, diagnose performance bottlenecks, and ensure your cluster is working optimally.
Working with data
Loading data
Imply loads raw data from file systems such as AWS S3, HDFS, or local files, and message buses such as Apache Kafka, or AWS Kinesis. The raw data is converted to a specialized column format that is highly optimized for fast groupings, filters, and aggregations. A traditional database "table" is known as a "datasource" in Imply, and a single Imply deployment may hold multiple datasources.
Visualizing data
Datasources can be visualized by creating one or more data cubes in Pivot. Each data cube contains a set of dimensions and measures. Dimensions are attributes of the data that you normally group or filter on. Measures are aggregates. Different visualizations can be created by dragging and dropping dimensions, and one or more measures can be displayed at any time. Data cubes have one primary visualization as the focus, and you can arbitrarily drill into the visualization through any combination of dimensions.
You create Dashboards from data cubes. Dashboards combine multiple visualizations into a single view and are best used to distill information rather than heavy exploration. Dashboards also support arbitrary filters. You can expand any given visual in a dashboard to return to the data cube view.
Direct queries
Imply's backend exposes a RESTful interface where you can issue queries directly. For more information, see the API documentation.