Viewing dashboards
Pivot lets you combine multiple views into a single dashboard, irrespective of the data cubes from which the views come. Using a dashboard, you can create effective and focused overviews of your data for your team.
Any Pivot user with AccessVisualization permissions can view dashboards for which there are no individual restrictions.
Filter your dashboard
You can add a filter to an interactive collection by clicking on the + button in the filter bar.
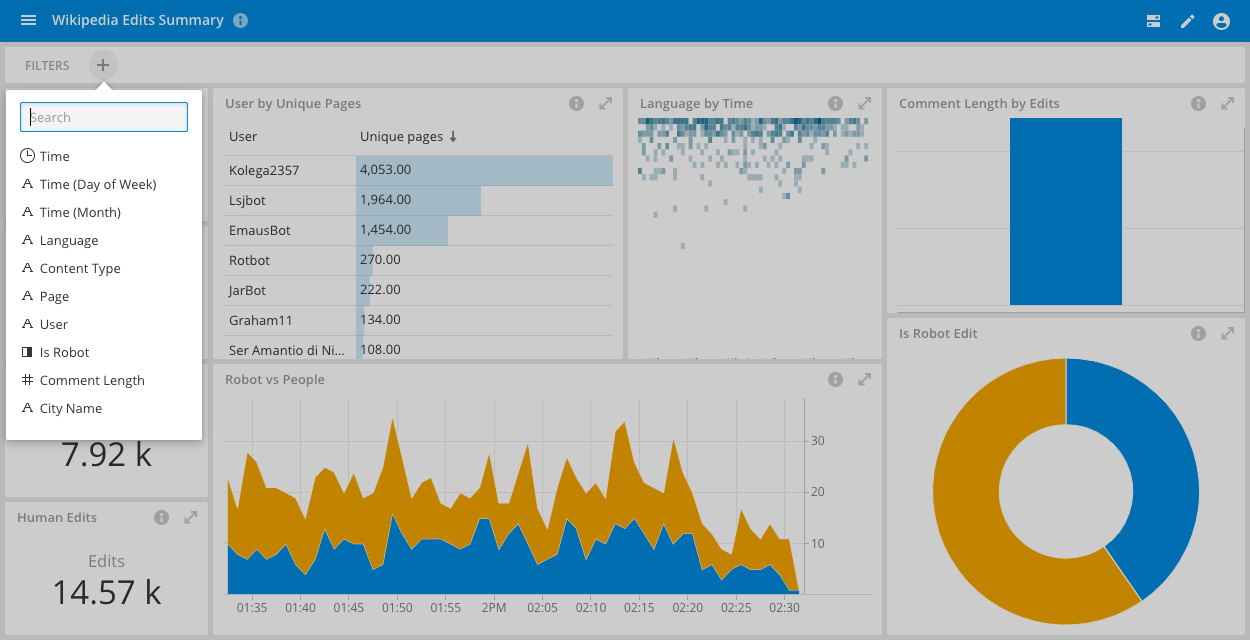
You can also click on visualizations and have that filter applied to all other views (as long as they share the filtered dimension).
Dashboard pages
Pages let you group multiple dashboard views into a single dashboard, so that any user can easily switch between them:
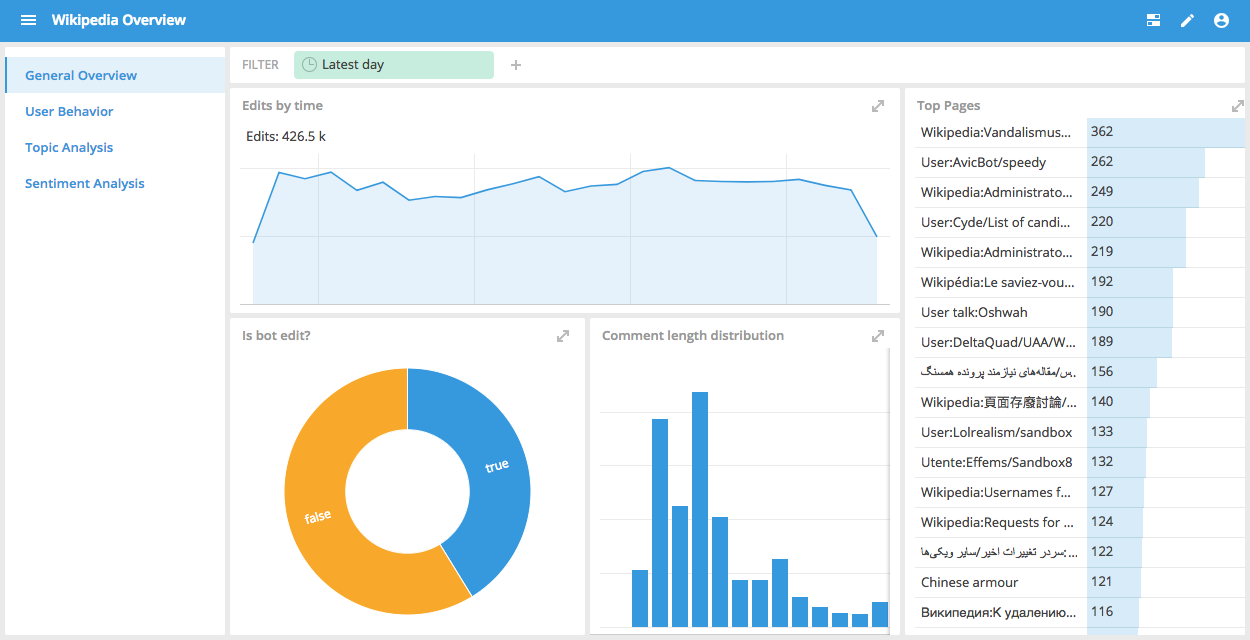
To create a page, go to Edit > Options > General > Pages and select "Show page selector." Click Save. Then edit the dashboard again, and click New page.
Access control
You can define access permissions for each dashboard. The access settings are in the Access tab of the Options panel. See Access Control for more information.
Additional options
Each tile menu contains additional settings. You can change the tile's visualization type in the Content field, specify the Data cube it comes from, add a Filter, and more. For example, under Visualization options, you can remove axes labels in some types of visualizations by unchecking Show axes if possible.