Managing data cubes
This topic explains how to create and configure a data cube.
About Pivot 2.0 and Pivot SQL data cubes
A data cube can be one of two types: Pivot 2.0 or Pivot Classic. The manner in which the types are enabled and accessed differs slightly between new Imply deployments that are new as of 2022.01 and deployments that have been upgraded to 2022.01 from a previous version. The differences are as follows:
- For new installations, Pivot 2.0 and Pivot SQL are enabled by default. An administrator can still disable these features using a feature flag. Disabling them results in new data cubes using Pivot Classic by default.
- For existing installations that have been upgraded from a previous version, there are no changes to existing data cubes or dashboards. Administrators can enable Pivot 2.0 and Pivot SQL as feature flags. If enabled, users have the ability to choose whether to use Pivot 2.0 or Pivot Classic when creating data cubes.
Note that Plywood cubes and Pivot Classic are deprecated and will be no longer supported in a future release of the product.
Create a data cube
To create a new data cube:
-
Click Create new data cube link from the Imply home page.
-
Select the data source data for the data cube:
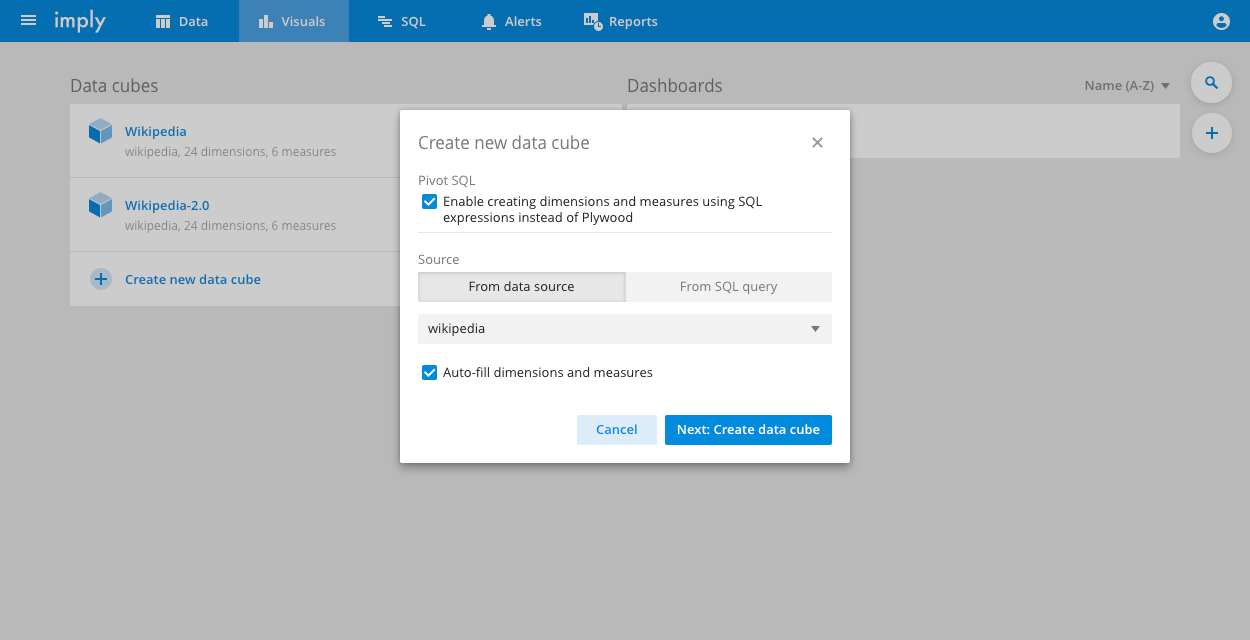
Depending on how your administrator has configured Pivot, you may have the ability to choose whether to make the data cube a SQL data cube. This enables Pivot SQL features in the data cube, such as the ability to specify dimensions and measures using Pivot SQL rather than the Plywood expression language.
-
You can check Auto fill dimensions and measures to enable automatic detection of the data schema, and populate the data cube with default dimensions and measures. The alternative is to create them manually.
Pivot does not auto-generate dimensions for array-type data in the schema and does not support arrays.
-
Click Next: Create data cube.
-
Complete the General properties for the data cube:
- Name: Name of the data cube.
- Description: An optional description.
- Default timezone: The data cube's timezone.
- Minimum auto-refresh rate: The minimum rate at which data in the data cube will refresh. Note that if you set a higher rate in the
defaultRefreshRateproperty, the minimum setting overrides it. See Data cube options for information on the default setting. - Primary time dimension: The time dimension Pivot uses for all time-related calculations for this data cube, including comparisons, filters, alerts, and reports.
- Query timeout override: The optional number of milliseconds to override the default 40-second query timeout. Setting this value higher than 660,000 (11 minutes), overrides the default value for the client timeout, which is 660,000.
-
Click Save to save the data cube.
Another way to create a new data cube is to duplicate an existing data cube and edit its properties. To do so, click the Duplicate button from the Edit data cube page of the source data cube.
After you've created a data cube, you can edit the data cube it to set up dimensions, measures, access, and advanced options.
Nested columns
Apache Druid supports directly ingesting nested data structures in COMPLEX<json> columns. See Nested columns for information on ingesting nested data. Once you've ingested your nested data, you can use Pivot to analyze it.
Follow the steps to create a data cube and select your nested data source. When you click Next: Create data cube, Pivot displays the suggested dimensions.
Pivot groups nested data together—for example, in the following screenshot, Color and Price are nested within Details:
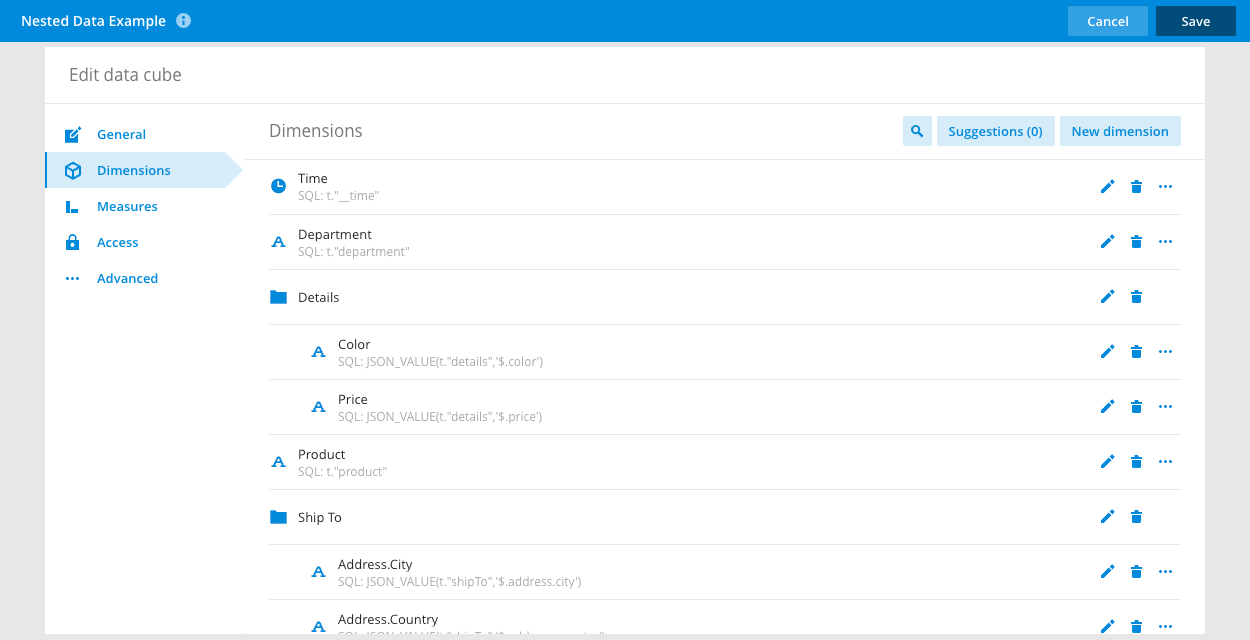
Note that Pivot recognizes nested column elements more than one level deep, but it doesn’t recognize arrays of objects. For example, Pivot doesn’t automatically recognize the following:
{
   "a":[{hello: 1},{goodbye: 2}]
}
See About data cubes for information on filtering nested data in Pivot.
Convert data cubes to Pivot SQL
In certain circumstances, you can convert an existing, non-SQL data cube into a SQL data cube.
Conversion to SQL is not possible for data cubes that use advanced options like altDataSource or data cubes that have individual dimensions or measures that can’t be converted to SQL for any reason. If you attempt to convert data cubes in such cases, an error dialog appears that indicates why the data cube can't be converted, including the expression or option that prevents conversion.
Note that converting a data cube to SQL can’t be reversed and may have unexpected consequences. As a backup measure, you should duplicate the data cube you intend to convert before attempting the operation on the original or copied data cube.
To convert a data cube to SQL, follow these steps:
-
Open the data cube settings by clicking the information icon in the data cube view and then clicking Edit.
-
Click the Advanced tab to open advanced settings for the data cube.
-
Click the Convert to SQL button at the bottom of the page.
-
Confirm the operation by clicking Convert:
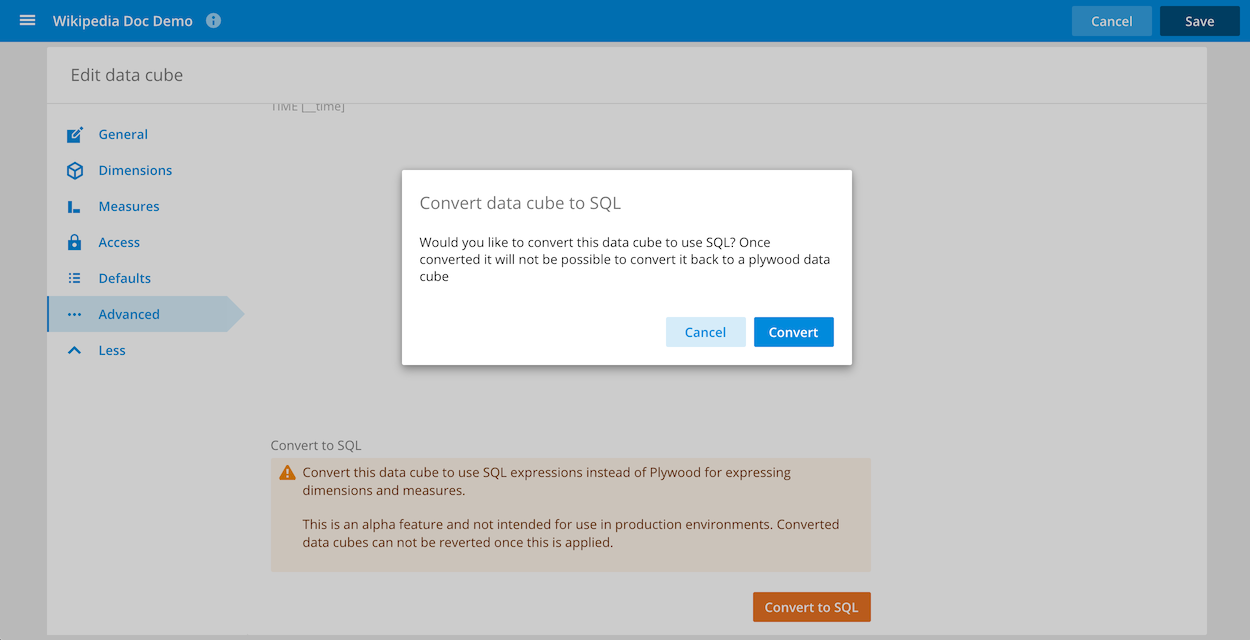
You can now use SQL expressions to compose dimensions and formulas, as described next.
Compose SQL expressions
Once a data cube is enabled for Pivot SQL, you can use SQL expressions to define custom dimension and measure formulas, as shown in the Formula field in the following figure:
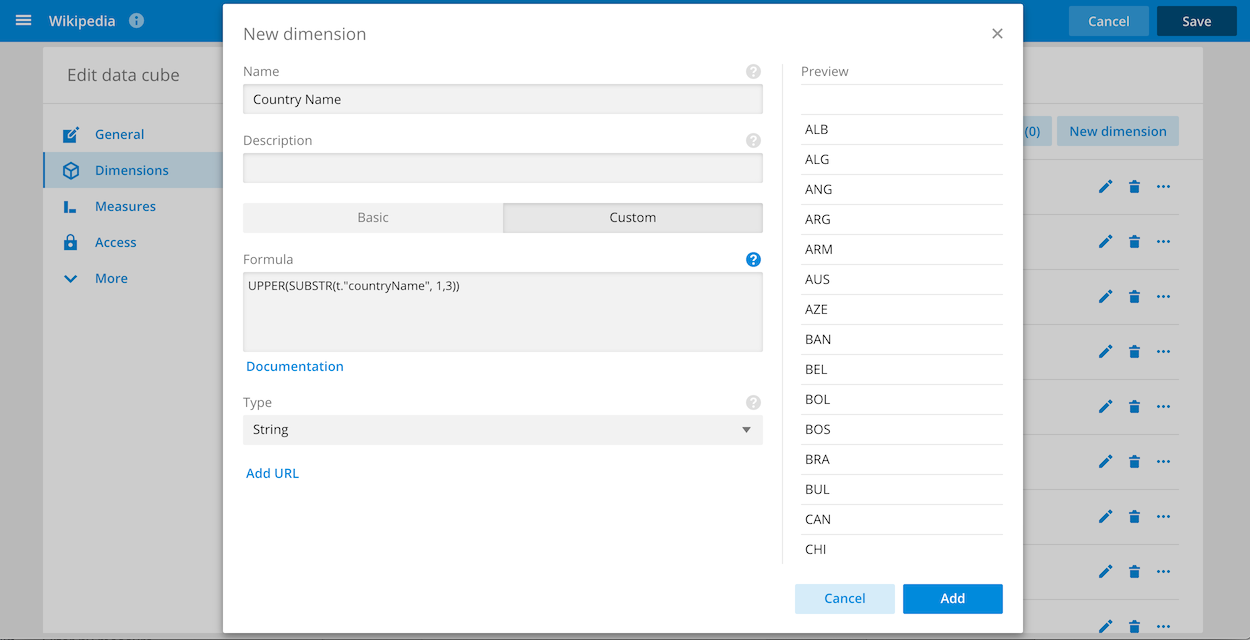
The syntax for querying columns follows the t.”columnName” format. Inline help in the data cube UI provides troubleshooting information in the event of syntax errors.
For more information about custom dimensions and measures in data cubes, including examples, see Measures and Managing data cubes. Also see Druid SQL for a complete list of supported SQL functions.
Note the following:
- Pivot SQL supports subset filters, filter tokens, PII masks
- Subset filters can be expressed as SQL; SQL support for filter tokens will be available in the future
- Data cube APIs support both SQL and Plywood on SQL data cubes; SQL data cubes can be created using the property: queryMode: “sql”
- All existing security constraints on user data access applies to SQL queries as well.
Also see the following limitations.
Limitations
The following limitations apply to the use of SQL in Pivot data cubes:
altDataSource(also known as native Druid UNION queries) are not currently supported- Support for lookups is provided only via the LOOKUP Druid SQL function
MilliSecondsInIntervalmagic constant for rate calculations is not currently supported- Resplit measures—for example, daily active users—must still be expressed using Plywood
- Druid functions requiring extensions aren't available unless the extension is loaded. For example, using
STDDEVrequires the stats extension to be loaded.
Edit a data cube
Click the pencil icon in the data cube header to edit the data cube.
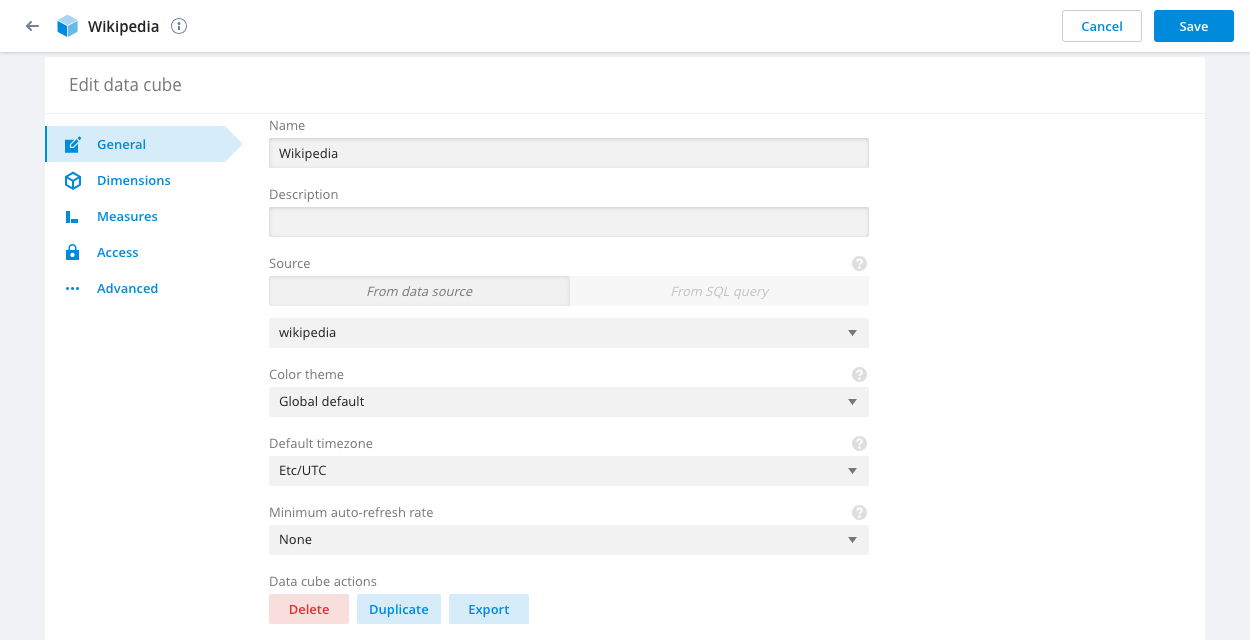
Within the edit view, you can change the general properties of the data cube.
You can also edit and create dimensions and measures from their respective tabs, set up access control and configure the advanced options.
Export and import data cubes
Pivot lets you export and import data cubes as JSON objects.
To export a data cube, click the pencil icon in the data cube header. From the General tab, click Export. The data cube downloads to your designated downloads directory.
Importing data cubes requires the ConfigureLookAndFeel privilege.
To import a data cube, follow these steps:
-
In the top right corner of the page, click the user menu icon.
-
Click Settings > Advanced.
-
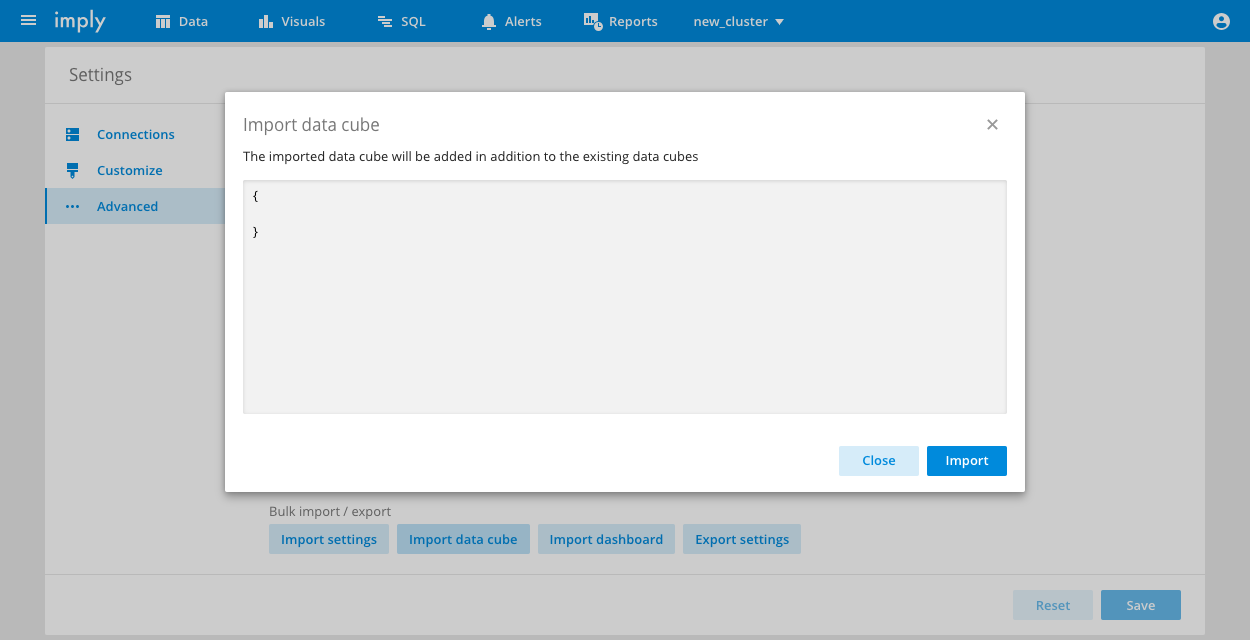
Click Import data cube. The following dialog box appears:
-
In the dialog, paste the JSON object for the data cube you want to import and click Import.
Data cube options
Click the options icon in the top navigation bar to set the following data cube options. The name of some options varies slightly between Pivot Classic and Pivot 2.0 data cubes.
-
Timezone: Set the data cube’s timezone. Click the cog icon to change the timezone for all data cubes and dashboards:
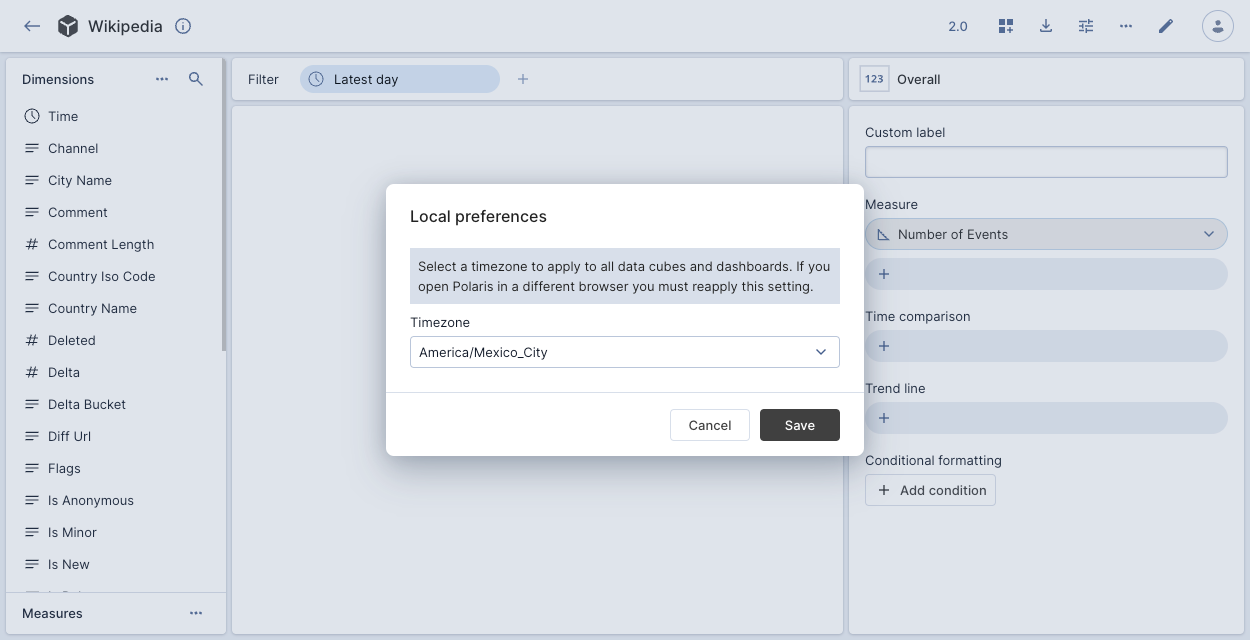 If you open Pivot in another browser you must reapply this setting.
 -
Cache Option or Query cache: Enable or disable the query cache for all dashboards and data cubes. The cache setting persists until you reload the page. The cache optimizes query performance, but can cause results to be slightly out of date—especially for stream-ingested rolled-up datasources.
-
Auto update or Refresh rate: Set the rate at which data in the data cube refreshes.
-
View raw data: View and download the raw data underlying the data cube.
-
View essence: View and copy the JSON structure of the data cube.
-
Monitor queries: View the underlying queries Pivot makes when you’re working with the data cube. You must enable the query monitoring feature first.
-
Update data cube defaults: Update the initial settings for the data cube view when you first navigate it.
-
Reset view: Reset the data cube view to the default view.
For a Pivot Classic data cube you can also select View essence to view the JSON request Pivot makes to display the data cube.
Create a link to a data cube
You can create a URL that links directly to a Pivot data cube. See Query parameters reference for information on the query parameters Pivot supports in the URL.
Schema detection
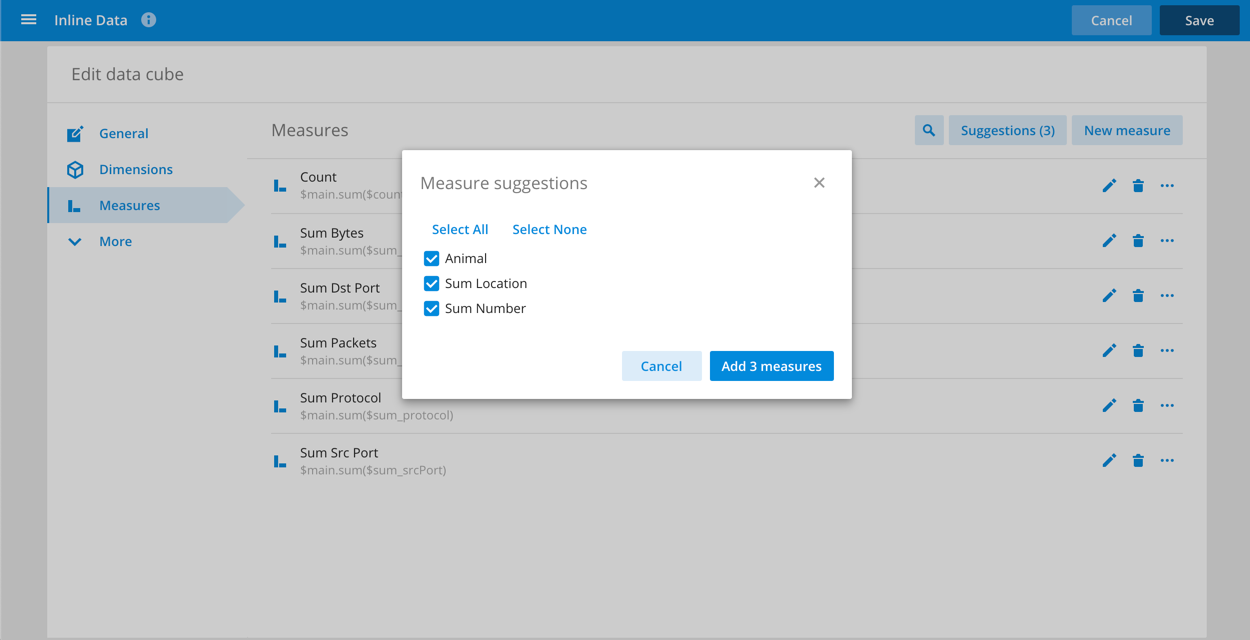
Pivot will automatically detect the columns in your data source and recommend some possible dimensions and measures.
Schema detection can be helpful when you are creating a new data cube in which case it will allow you to initialize the data cube with some dimensions and measures.
The other use for schema detection is when you evolve your schema and add columns over time.
If you have just added a column and you want a corresponding dimension to be created for it, you can use schema detection to automatically construct that column for you.
This functionality is accessible from the Suggestions tab of the
New dimension and New measure modals.
How schema detection works
Pivot looks at the dataset metadata and uses the returned list of columns, their types, and their aggregation (in case of rollup) to determine what dimensions and measures to suggest.
Pivot generates dimensions and measures by applying the following rules to the discovered underlying column types:
- Time columns get mapped to a dimension with automatic bucketing by default.
- String columns get mapped to a dimension.
- Numeric columns get mapped to a
SUMmeasure or an otherwise appropriate measure if the column is marked as being aggregated as part of rollup. - ApproximateHistogram columns get mapped as a 98th percentile measure.
- HyperUnique and ThetaSketch columns get mapped to a
countDistinctmeasure.
Limitations
While schema detection is an invaluable tool for quickly getting you up and running with a new data source, it can never do a perfect job.
Once you create a data cube you should play with it and tailor it to be perfectly suited to your needs.
Don't hesitate to change and delete the auto-generated dimensions and measures; they will always be there in the Suggestions tab.
Specifically, schema detection cannot detect the following:
- Array data.
- String columns that you might want to see as
countDistinct- number of unique values. - The perfect granularities to apply to time and numeric dimensions.
- Lookups that you might want to apply to certain dimensions.
- Dimensions that actually correspond to a URL.
- Measures that are interesting when filtered on something.
- Measures that should be seen as a ratio, or some other post aggregation.
Defaults
The default settings control the initial settings for the data cube view when you first navigate to the data cube. By default, the data cube shows data from the latest day and the first measure in the list of available measures for that data cube.
You can modify these defaults, add filtering conditions, or set a specific dimension to be shown with the default settings.
To create a default view:
- Create the view you want to save as your default view.
- Click the Options menu in the top right.
- Click Update data cube defaults.
- Click Set current view as default.
- Click Save for all users.
Advanced options
Click Advanced in the left pane to edit the following data cube options:
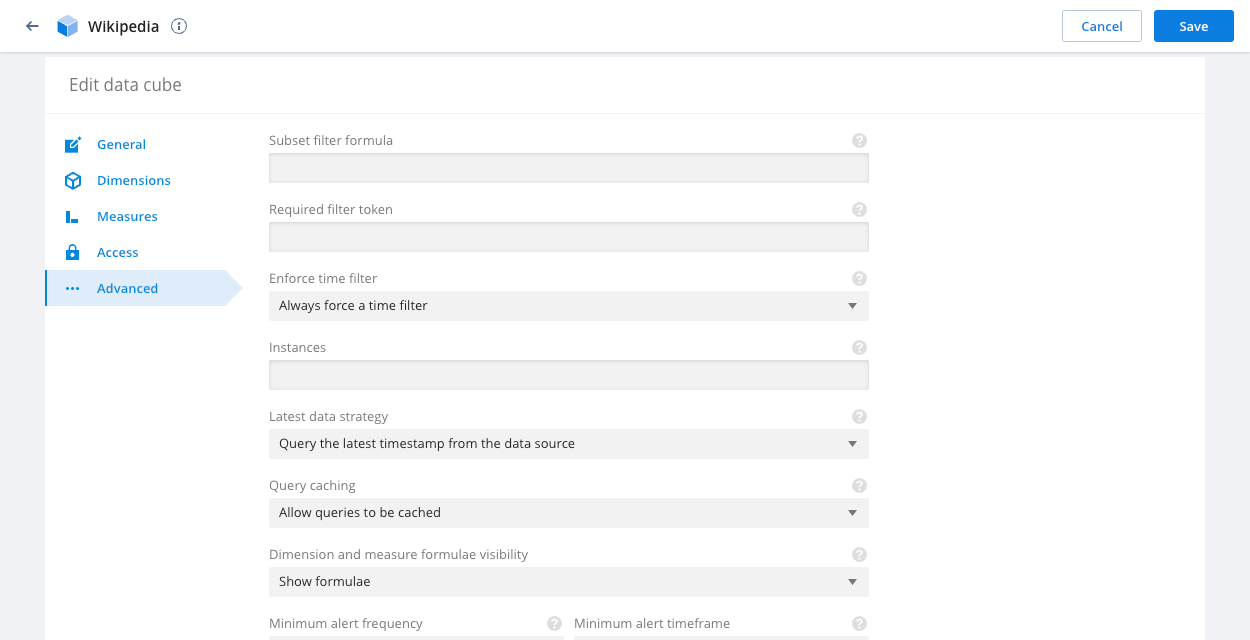
Subset filter formula: Specify a plywood formula that applies a mandatory, hidden filter to all queries made through this data cube. See row level restriction.
Required filter token: Specify a token that corresponds to a filter token defined in a user role. See token based row level access control.
Primary time dimension: Specify the time dimension that corresponds to when the data point was actually added. This is used for checking the freshness of data and also potentially enforcing a time filter. Defaults to Time.
Enforce time filter: If set to true, ensures that every query is filtered on the primary time dimension. This should be used if time unbounded queries are likely to be slow due to the volume and tearing of data.
Instances: Configure multiple filtered instances within a single data cube via a configuration object. See example configuration.
Latest data strategy: Determines how Pivot calculates the latest data time for the data cube. Options are:
- Query the latest timestamp from the data source. This is the best option when loading historical data.
- Use the current time. This is the best option when ingesting real-time data.
Alternatively, you can use the fixedMaxTime property in the options to define a fixed time.
Latest time filter granularity: When using a relative time filter, Pivot applies this level of granularity to align filter boundaries when querying the underlying table. If you applied data rollup at ingestion time, set to the granularity used during ingestion or select Infer from latest timestamp. If you're not using rollup, set to Infer from latest timestamp.
Query caching: Specify query caching behavior. Allowing caching can greatly speed up exploration but can also cause results to be a little out of date especially in realtime rolled up datasets.
Dimension and measure formulae visibility: You can hide formulae for dimensions and measures that appear in the info box of dimensions and measures. Formulae are shown by default. An administrator can select Hide formulae when the formulae might reveal information that is too sensitive for all Pivot users in the organization to view. When the Hide formulae option is selected, an administrator can still view the formula for a dimension or module in its Settings view.
Minimum alert frequency and Minimum alert timeframe: The minimum allowed frequency and timeframe for alerts created for this data cube. If set, these options become the minimum Check every and Time frame options for alerts. Users with the CreateElevatedAlerts permission or the Super Admin role are not subject to these restrictions when creating alerts.
If existing alerts on the data cube violate these settings, Pivot sends an email to the alert's admins and a warning appears in the UI when the alert triggers.
Time series max entries: Maximum number of entries allowed in a time series visualization. Overrides the timeSeriesMaxEntries data cube option which defaults to 500,000.
Custom comparisons: Click Add Compare to create a custom comparison period. Enter a Time length and select a Unit, for example 3 days. Custom comparison periods appear in the Comparisons drop-down when you're exploring a data cube. See Time comparisons for more information.
Data cube options
Additional data cube configuration options as JSON with any of the following properties:
fixedMaxTime: Specify a fixed time value for data cubes to use as the latest "max time" instead of querying for it or using the current time. This configuration should be used in conjunction with theRefresh timesetting set to 'fixed'.timeoutOverride: Override a connection-wide timeout for queries made through this data cube.exactResultsOnly: Disables approximation and sets query precision to Exact for ranking (TopN) and aggregation (COUNT DISTINCT) queries. This setting improves accuracy but can degrade query performance. When enabled, users can't switch between Approximate and Exact. For certain visualizations, the underlying query may ignore approximation settings. For an example, see Flat Table.timeSeriesMaxEntries: Maximum number of entries allowed in a time series visualization. Defaults to500,000.customAggregations: Map any Druid aggregation to a Pivot measure. Aggregation definitions should be keyed on measure names.customTransforms: Map any Druid extraction function to a Pivot dimension. Extraction function definitions should be keyed on dimension names.crossTabBatchSize: Configure the number of cross tab rows loaded at once (defaults to80).piiMask: Define a threshold below which data is considered Personally identifiable information (PII) and hidden. See the piiMask example.restrictedModeProperties: Define a restricted edit mode for access control which grants users limited edit functionality for a data cube. See the restrictedModeProperties example.defaultTimeBounds: By default, relative time filters are inclusive of the start bound and exclusive of the end bound. You can use this property to override the default. Use brackets for inclusion and parentheses for exclusion. The following example excludes the start bound and includes the end bound:{
"defaultTimeBounds":"(]"
}
Time filter presets
Each section of presets in the time filter menu can be configured with custom presets. See an example of latest presets.
latestPresets: An array of preset objects that will override theLATEST DATApresets in the time filter menu.currentPresets: An array of preset objects that will override theCURRENTpresets in the time filter menu.previousPresets: An array of preset objects that will override thePREVIOUSpresets in the time filter menu.
Querying options
splitLimits: Provide an array of numbers that will override the default options of[5, 10, 25, 50, 100]shown in the limit dropdown of the split menu.ignoreDimensionInExplain: Provide a list of dimensions to ignore when computing an explanation.rankExpression: Configure the measure whose value is used to order dimension values in the dimension filter menu. Defaults tocount.druidContext: An object that will be passed in as the Druid query context.priority: A number that will be passed as 'priority' into the Druid query context.maxDownloadLimit: Configure a limit (in number of rows) to downloads.largeDownloadInterval: Configure a limit (as a time interval) to downloads.
Visual options
suppressOverallByDefault: If true, hides the "overall" element of a visualization by default.boostPrefixRank: If true, will "boost" dimension values where matches occur at the beginning of the string over values with matches found in other positions in the dimension filter menu.boostSelectedMeasures: If true and the data cube view is in multi-measure selection mode, will "boost" selected measures to the top of the measures list in the measure picker menu.grayOutTrivial: If true, renders "trivial" dimensions in gray in the dimensions panel. A continuous dimension is trivial if it has a max value equal to its min value. A discrete dimension is trivial if it has less than 2 values.alwaysShowCompareControl: If true, will remove the ability to toggle time compare.disablePreview: If true, disables the preview of values in the dimension and measure modals.showExplainBadge: If true, shows a badge with the standard deviation for the sample values used for the explanation.
Examples
Instances
{
  "dimensionFormula": "$language",
  "values": [
    {
      "title": "English",
      "value": "en"
    },
    {
      "title": "Chinese",
      "value": "zh"
    },
    {
      "title": "Spanish",
      "value": "es"
    }
  ]
}
dimensionFormula is a plywood formula that operates on a dimension.
values is a list of objects with keys of title, value where value is the value that will be matched with the dimensionFormula expression and title is the label displayed in the UI.
piiMask
{
  "piiMask": {
    "aggregate": "$main.count()",
    "threshold": 10,
    "maskText": "HIDDEN [%i]",
    "otherText": "Other (%i)",
    "hideAggregates": false
  }
}
Note that %i will be resolved as the row index of the datum
latestPresets
latestPresets appear as time filter values in the data cube view. You can create presets for custom time values, as in the following
example:
{
  "latestPresets": [
    { "name": "1M", "pillLabel": "1 minute", "selection": "$m.timeRange('PT1M', -1)" },
    { "name": "5M", "pillLabel": "5 minutes", "selection": "$m.timeRange('PT1M', -5)" },
    { "name": "30M", "pillLabel": "30 minutes", "selection": "$m.timeRange('PT1M', -30)" },
    { "name": "1H", "pillLabel": "1 hour", "selection": "$m.timeRange('PT1H', -1)" },
    { "name": "6H", "pillLabel": "6 hours", "selection": "$m.timeRange('PT1H', -6)" }
  ]
}
In the UI, the value of name appears as the UI label in the presets dropdown, while the optional pillLabel appears as the label when the
value is selected. If pillLabel is
not provided, name is used in both places. The selection value is the interval of
time selected. The sample presets above would appear as follows:
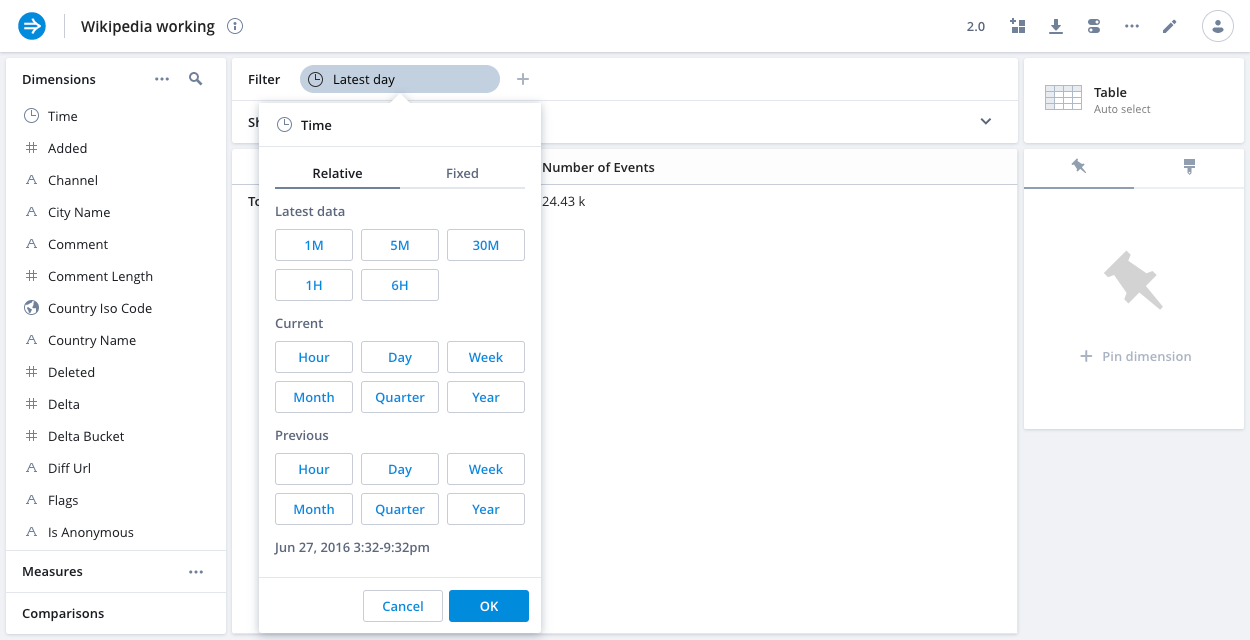
In the selection value, $m is resolved as the data's maximum time and $n as the current time.
Since $m is a time value, if you would like to add a preset to view all data for the last seven days,
with full data for each day, you would need to adjust $m as shown in the following example:
{
  "latestPresets": [
    { "name": "7D", "pillLabel": "7 days", "selection": "$m.timeFloor('P1D').timeRange('P1D', -7)" }
  ]
}
restrictedModeProperties
When set, this property will expose an additional access control list configuration in the data cube's "Access" section, enabling the ability to grant users and/or roles a subset of full edit functionality.
{
  "restrictedModeProperties": [
    "dimensions",
    "measures"
  ]
}
The configuration above would allow users and roles granted "Restricted edit access" on the "Access" screen the ability to edit the data cube's dimensions and measures, but nothing else.
The values that can be set for this array are:
"title": The data cube name"description": The data cube description"theme": The data cube theme"dimensions": Dimensions"measures": Measures"group": Dimension groups"defaultDuration": Default time filter duration"defaultSelectedMeasures": Default selected measures"defaultPinnedDimensions": Default pinned dimensions"defaultRefreshRate": Default refresh rate"defaultTimezone": Default time zone"defaultFilter": Default filter"defaultSplits": Default shown dimensions"subsetFormula": Subset filter formula"filterTokens": Required filter token"specialTimeDimension": Primary time dimension"enforceTimeFilter": Enforce time filter"instances": The possible instances for the data cube"refreshTimeWith": Refresh time"queryCaching": Query caching