Customizing the Pivot UI
You can customize the look and feel of Pivot to align it with your organization's branding.
Custom logos
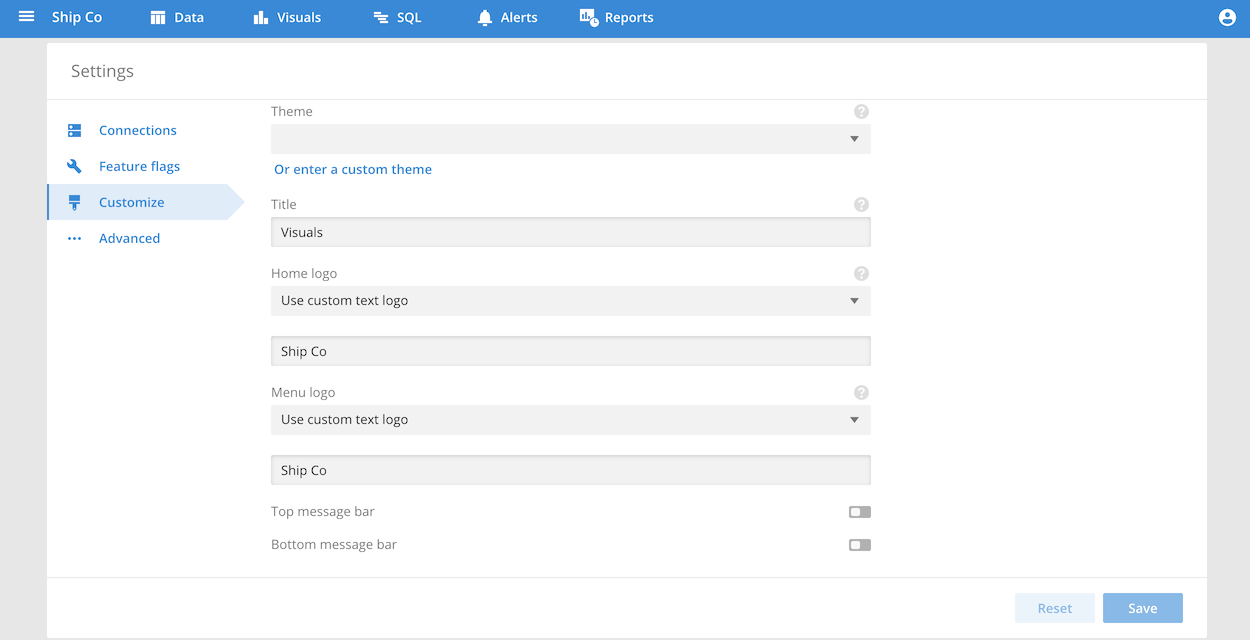
You can customize the logo that appears in the top header bar and in the slide-out navigation menu from the Advanced settings. The custom log field allows you to set a logo as either text or as an image in SVG format.
To set a custom logo, follow these steps:
-
From your profile menu, click Settings.
-
Click the Customize tab.
-
Use the Home menu and Menu logo settings to configure the custom logo. For example, to use text, choose Use custom text logo from options and enter the text to use.
-
Click Save to apply the change:

If you specify an SVG logo, we recommend using a white (or light) logo for best visual results. Here is a sample SVG logo to try:
<svg width="142" height="48" viewBox="0 0 142 48" fill="none" xmlns="http://www.w3.org/2000/svg"><path d="M141 25L127 47H20L2 25H40V12H100V25H141Z" fill="#C4C4C4"/><path d="M40 25H2L20 47H127L141 25H100M40 25V12H100V25M40 25H100" stroke="black"/><path d="M140 26H3L20 47H127L140 26Z" stroke="black"/><path d="M40 12V25H101V12H40Z" fill="#FFFCFC" stroke="black"/><path d="M53.5 19C53.5 20.8793 51.7661 22.5 49.5 22.5C47.2339 22.5 45.5 20.8793 45.5 19C45.5 17.1207 47.2339 15.5 49.5 15.5C51.7661 15.5 53.5 17.1207 53.5 19Z" fill="#C4C4C4" stroke="black"/><path d="M92.5 19C92.5 20.8793 90.7661 22.5 88.5 22.5C86.2339 22.5 84.5 20.8793 84.5 19C84.5 17.1207 86.2339 15.5 88.5 15.5C90.7661 15.5 92.5 17.1207 92.5 19Z" fill="#C4C4C4" stroke="black"/><path d="M73.5 19C73.5 20.8793 71.7661 22.5 69.5 22.5C67.2339 22.5 65.5 20.8793 65.5 19C65.5 17.1207 67.2339 15.5 69.5 15.5C71.7661 15.5 73.5 17.1207 73.5 19Z" fill="#C4C4C4" stroke="black"/><path d="M63 1V11H74V1H63Z" fill="#3D3A3A" stroke="black"/></svg>
When you paste SVG code into the home or menu logo fields, Pivot validates the SVG code. (If the code is invalid, the text input field is highlighted in red and the Save button disabled.)
Note that line breaks are not currently supported in the content of the SVG input field. Before you can save your changes, you must remove any line breaks from your SVG code.
Custom message bars
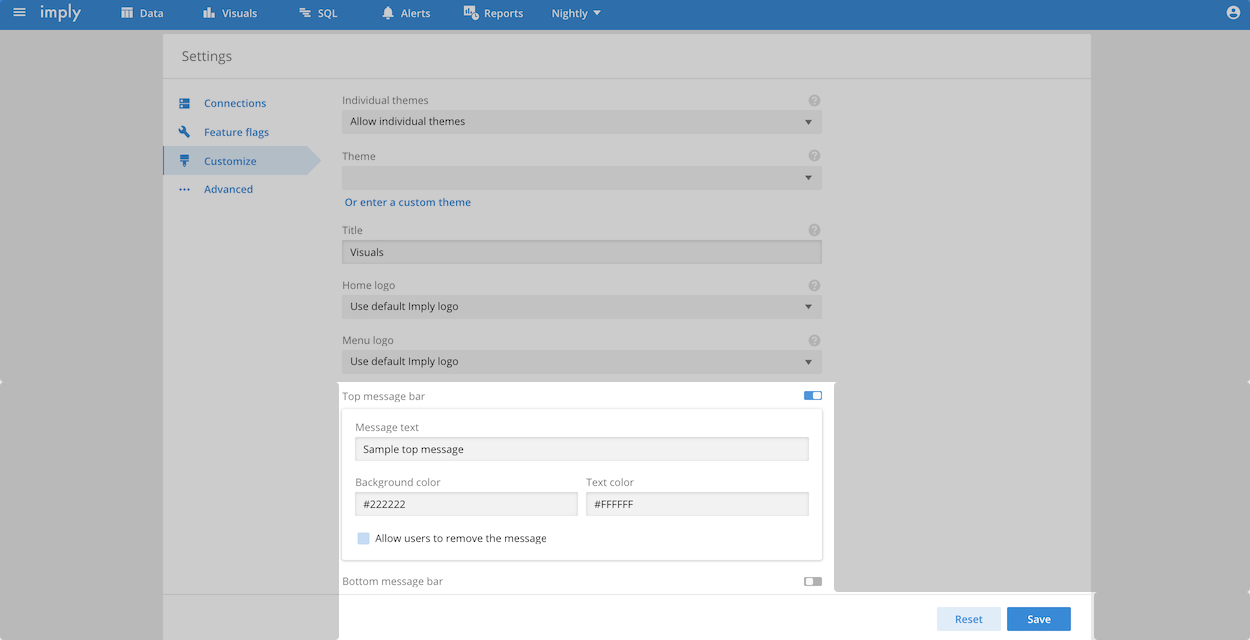
You can use message bars to post notices or announcements in Pivot that are visible to all your Pivot users. You can add a custom message bar to appear at the top or at the bottom of every page in Pivot. Switch the toggle next to Top message bar or Bottom message bar to ON. Then enter the text that you want to appear. You can choose to allow users to remove a message bar once they have seen it. Otherwise, a message bar persists until you change and save its settings. You can also choose a background color and text color for your message bar:

Custom colors
You can modify the colors in Pivot to match your brand or visual preferences. You can customize colors for UI elements, such as the top menu color, and the colors used for visualizations, as described below.
Customize Pivot UI element colors
You can specify custom colors for the theme that will be used in Pivot.
You can configure the following colors:
mainColor- The color used for the header and primary accents.darkColor- The color used for the darker accents, like tooltips.backgroundColor- The color used for the background.
Customize visualization colors
Pivot visualizations use a default color palette that you can modify. A custom Pivot visualization color palette applies throughout Pivot, including to dashboards and data cubes.
To specify custom visualization colors, follow these steps:
- From the top-left hamburger menu, click Settings.
- Click Customize from the left navigation menu.
- Add your set of custom colors in the Color palette field as JSON data. You can provide colors for:
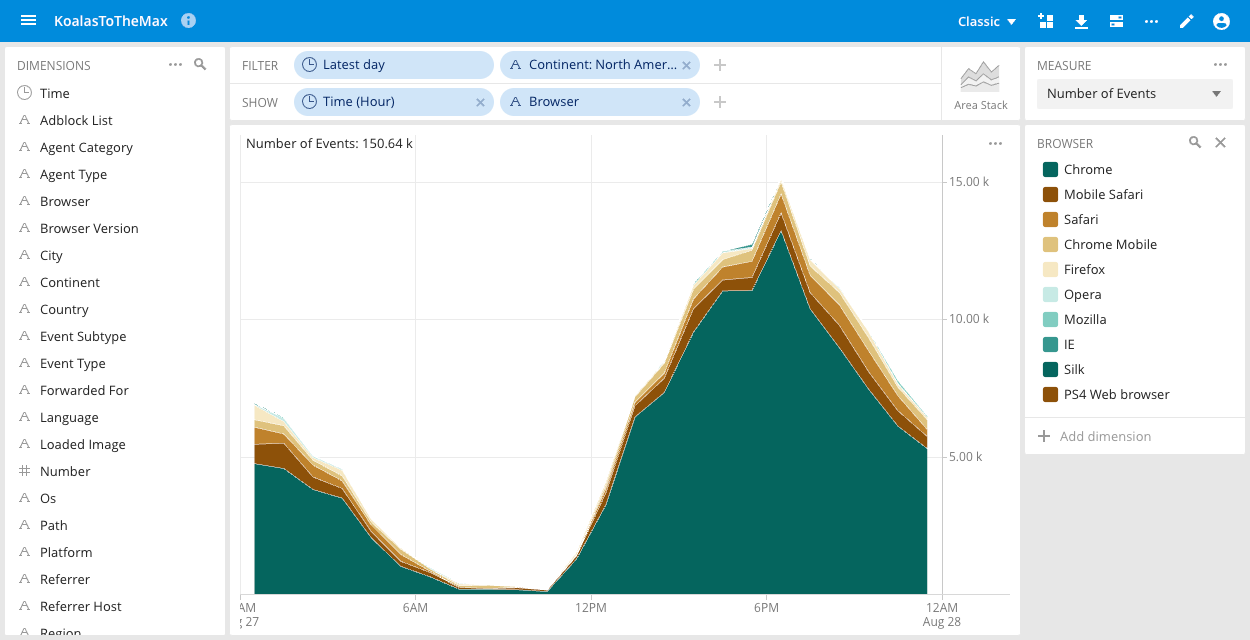
nullColora single color that serves as background and unpopulated areas.otherColora single color that is used for the Other category in visualizations. Other is used as the category for data in which the dimension value is empty.categoricalPalette: a set of colors used to differentiate category-oriented datacontinuousPalette: a set of colors used to differentiate ranged data
For example, the following sample defines categorical and continuous palette colors:
{
  "otherColor": "#C7CCD7",
  "continuousPalette": [
    "#f7fcfd",
    "#99d8c9",
    "#005824"
  ],
  "categoricalPalette": [
    "#8c510a",
    "#bf812d",
    "#dfc27d",
    "#f6e8c3",
    "#c7eae5",
    "#80cdc1",
    "#35978f",
    "#01665e"
  ]
}
The custom colors appear in the following area stack chart example, with categoricalPalette values representing the different types of browsers:

Embedded visualizations
Embedded visualizations are an alpha feature that should be considered preview and subject to change or removal at any time. Alpha features are provided "as is," and are not subject to Imply SLAs.
You must run Pivot in direct access mode to use the embedded visualizations feature in a Hybrid cluster.
You can embed any visualization from a Pivot classic data cube as an iframe within your own application.
A Pivot user with the ChangeFeatureFlags permission can enable embedded visualizations:
- Click your Profile icon in the top navigation bar.
- Click Settings.
- Click Feature flags, and toggle the Embedded visualizations feature so that it is enabled.
- Click Save.
Once the embedded visualizations feature is enabled, you can embed a visualization:
- In a Pivot classic data cube that contains a visualization that you want to embed, click the Options icon.
- Click Embed visualization.
- On the window that appears, click Copy to copy the visualization's code.
- Paste this code wherever you want it in your application.
A user must be logged into Pivot to view an embedded visualization. If a user is not logged into Pivot, a 404 error message appears in place of the embedded content.
You can view examples of embedded visualizations in the Imply iframe examples repository.