Quickstart
This quickstart shows you how to use the Imply Polaris web interface to ingest, query, and visualize data.
For a high-level overview of Polaris components, see Key concepts.
Prerequisites
You must use one of the following supported browsers:
- Last three versions of Chrome, Firefox, Edge (Chromium version), Opera
- Firefox ESR
- Safari (desktop) 16 or above
Sign up for an account
You can sign up for a Polaris account directly on Polaris or through the marketplace of your cloud provider for integrated billing.
The method you use to sign up for Polaris determines how your organization is billed. If you sign up directly on Polaris, Polaris bills you for the resources you consume. If you sign up through a cloud provider, the provider handles the billing. To change your billing method, contact Polaris support.
When you sign up on Polaris, you are automatically enrolled in a free trial and receive a US$500 credit to use on projects during the first 30 days. You can convert the trial to a paid plan at any time by adding a payment method to your billing profile or by signing up for a Savings plan with a Polaris representative. Paid billing starts once your trial credits expire or 30 days after trial activation, whichever comes first.
Follow these steps to sign up for a Polaris account:
Go to https://signup.imply.io.
Enter your information in the sign-up form.
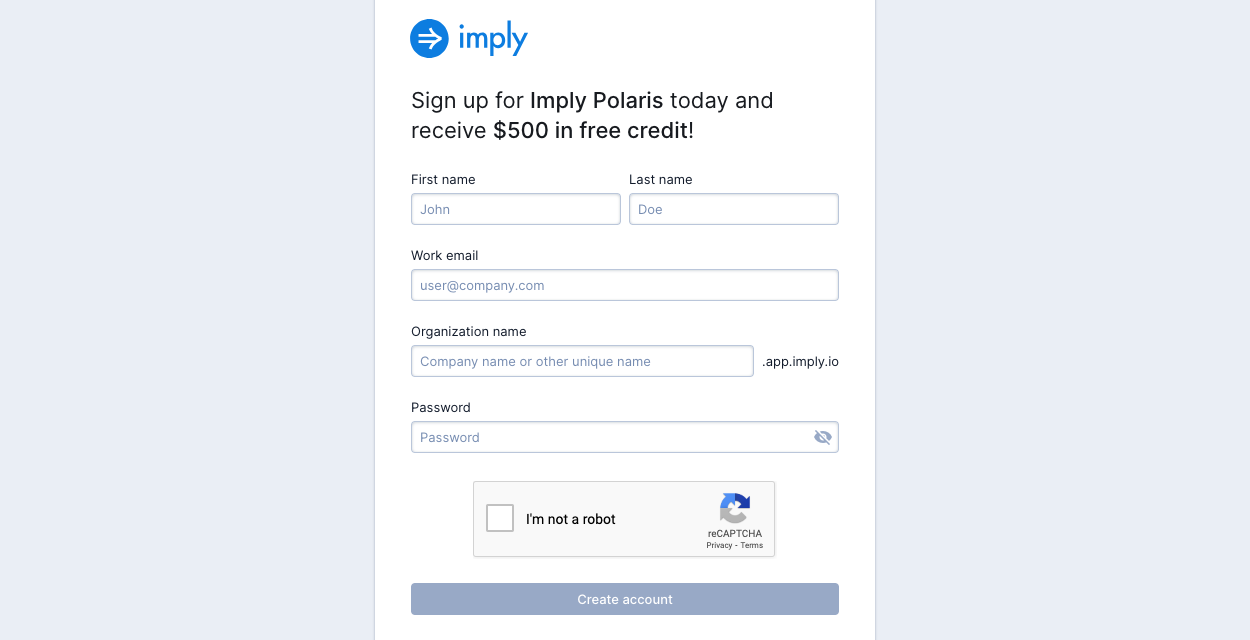
Your organization name must meet the following criteria:
- It must contain a minimum of 3 and a maximum of 63 characters. Characters are letters, numbers, and dashes.
- It must begin with a letter or a number and end with a letter or a number.
- It cannot start or end with a dash.
- It cannot contain symbols such as asterisks, underscores, and exclamation points.
- It cannot end with -imply-cloud.
Polaris doesn't accept free email addresses for new accounts.
- Click Create account.
- Check your inbox for a confirmation email from Imply. You must verify your email address to create an account. If you do not receive a confirmation email or have trouble signing up, email Polaris support.
After you've verified your email address, you should receive a welcome email from Imply containing a link to your Polaris account. Click on the link in the email to access your account.
At first login, Polaris prompts you to create your first project. Enter the project name and select a cloud provider and region for the deployment of your project.
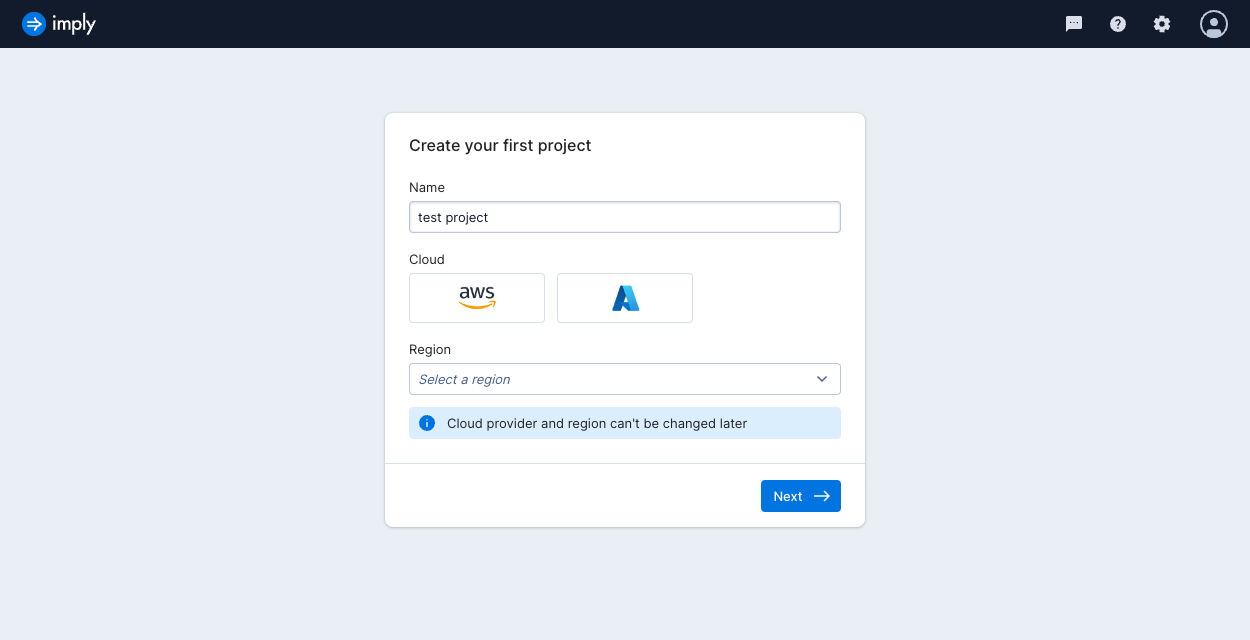
You can't change the cloud provider and region once you finalize your selection. You can only have one project in the selected region during the trial period.
Load data
This section explains how to load batch data into a table so you can start using Polaris quickly. See Table schema to learn about table design.
Download the sample data
Download a day of clickstream activity from KoalasToTheMax.com. This newline-delimited JSON file is the source data for the quickstart. See Supported data formats for more information on data and file format support in Polaris.
Upload a file and view sample data
To upload the sample data, follow these steps:
Click Jobs in the left pane.
Click Create job > Insert data.
In the Create new table dialog, enter
Koalas to the Maxfor the table name. IfKoalas to the Maxis in use, append a number to make your table name unique. Table names must be unique. Once you create a table, you can't change its name.Click Next.
In the BATCH section, click Files.
Click Upload files from your computer and choose the file you downloaded,
kttm-2019-08-19.json.gz, then click Open. You can select multiple files for a single ingestion job but for the purpose of the tutorial, choose only the one file. The file name must be unique.When the upload is complete, click Next. Polaris determines the appropriate table type and schema mode from the ingestion job. See Table schema and mode and Types of tables to learn more.
Polaris samples your data and displays the input field names and data types—for example:
continentis a string.session_lengthis in long format.
At this point you could add input fields, remove input fields, or adjust the data types. For the purpose of the tutorial, click Continue to proceed with ingestion.
Map input fields to Polaris columns
Polaris uses your sample data to identify the input format and suggest a schema for your target table. For the purpose of the tutorial, accept the automatic mapping.
Confirm the primary timestamp.
In this case, Polaris suggests the input field
timestampfor the__timecolumn which is correct. To learn about time column handling in Polaris, see Timestamp expressions.Optionally, edit the column properties for how you want Polaris to store them. For example, you can change the column agent_category or agent_type.
You can also set the Input expression to alter the values for the column. By default, Polaris maps the input field directly to a column with the same name. To alter the value, you can apply a scalar expression—for example,
UPPER("country")to store country values in uppercase.When you're ready to start your ingestion job, click Start ingestion.
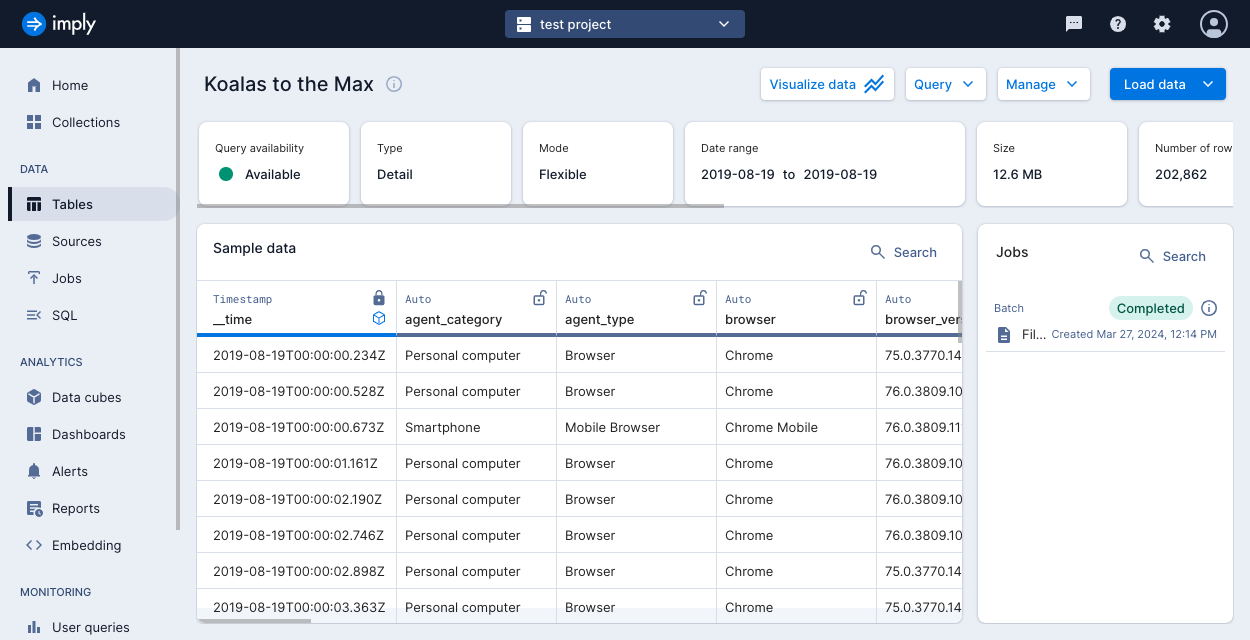
Polaris displays the ingestion job status in the Jobs pane on the right. When the ingestion job status changes to Completed, you can start querying your data. This can take a few minutes.
Query data
Now that you've ingested data into Polaris, you're ready to run some queries.
On the table detail page, click Query > SQL console. Or, from the home page, click SQL in the left sidebar.
Look for the dataset you just uploaded by table name.
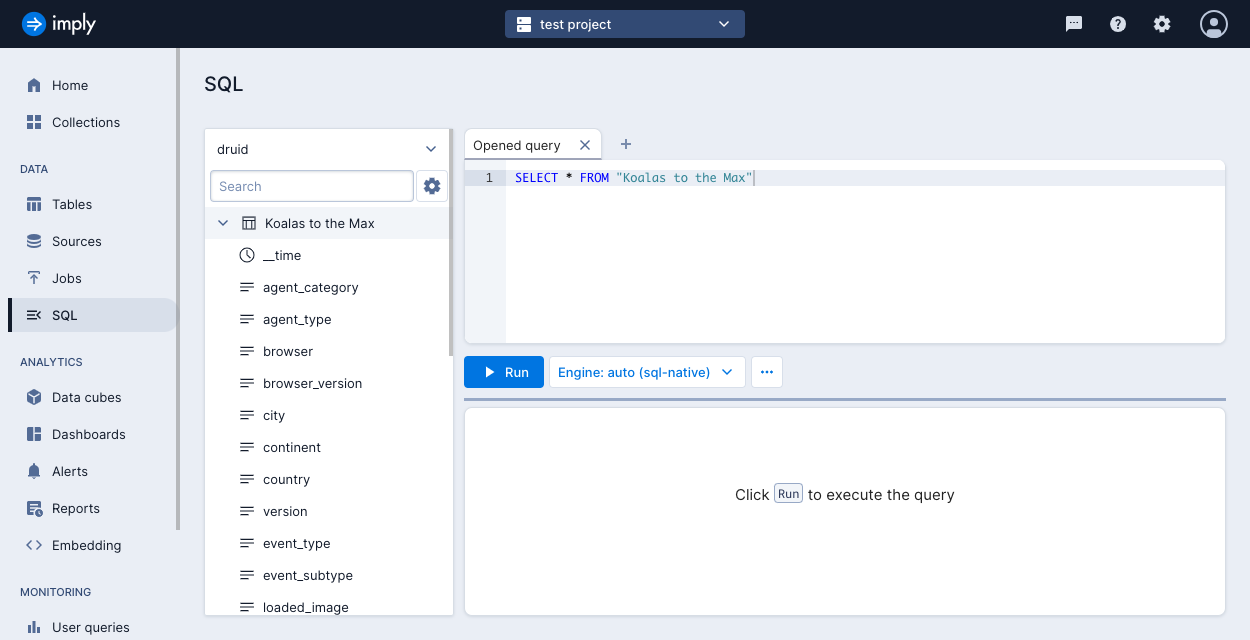
Click the arrow next to the table name to see the table's columns.
Enter the following query in the query window:
SELECT * FROM "Koalas to the Max"
WHERE "__time" BETWEEN TIMESTAMP '2019-08-19 00:00:00' AND TIMESTAMP '2019-08-21 00:00:00'
Click Run.
Instead of returning all of the columns in the table, you can select individual columns by name—for example, you can run the following query to show just the cities:
SELECT "city" FROM "Koalas to the Max"
WHERE "__time" BETWEEN TIMESTAMP '2019-08-19 00:00:00' AND TIMESTAMP '2019-08-20 00:00:00'
Visualize data
Visualization features let you explore and draw insights from your data. There are many types of visualizations available in Polaris, including table view, line chart, and heatmap. See Visualizations reference for details of all visualizations.
Create a data cube
Data cubes contain data from one or more data sources and provide an interface to explore a data set. Make a data cube for Koalas to the Max:
Click Data cubes in the left sidebar.
Click Create data cube.
Select From table as your source and select the table you created, Koalas to the Max. Leave Auto-fill dimensions and measures checked.
Click Next: Create data cube.
Click Save. The data cube appears:
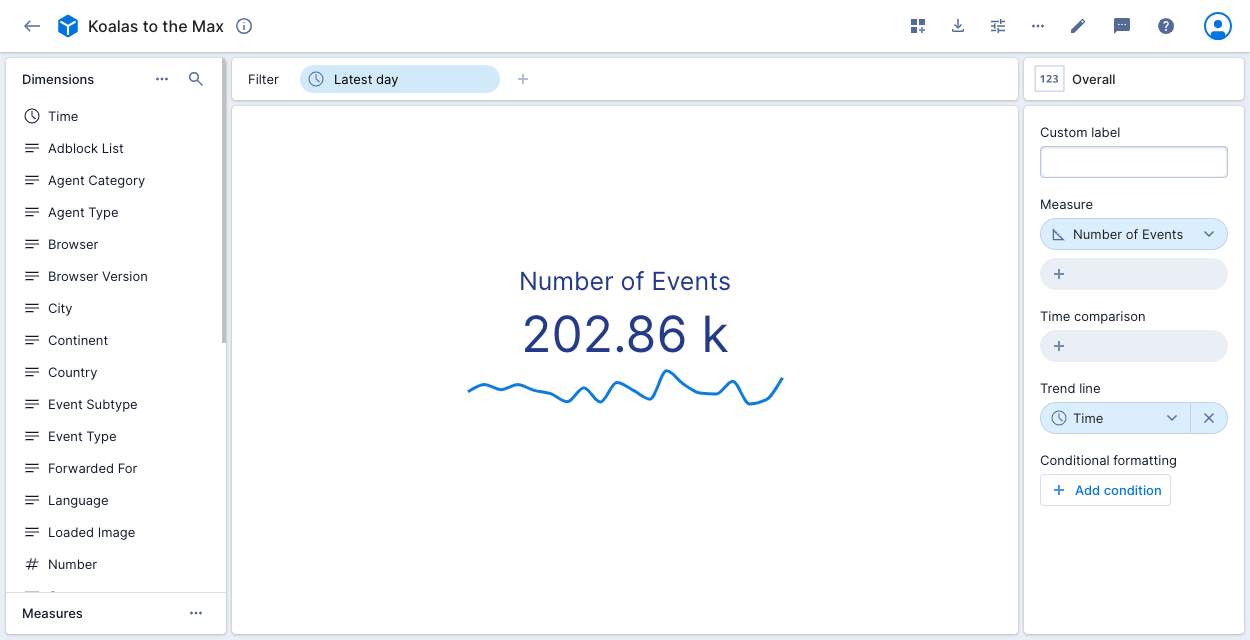
You can use the data cube to view aggregated data. To view the number of events by country, drag the Country dimension from the left pane into the Show field in the center of the page.
Create a dashboard
Using a dashboard, you can create effective and focused data visualizations. A dashboard displays the results of several data cubes in a single view. Add a dashboard for the Koalas to the Max data cube:
Click the back arrow in the top left corner, then click Dashboards in the left sidebar.
Click Create dashboard.
At the top of the page, give your dashboard a name.
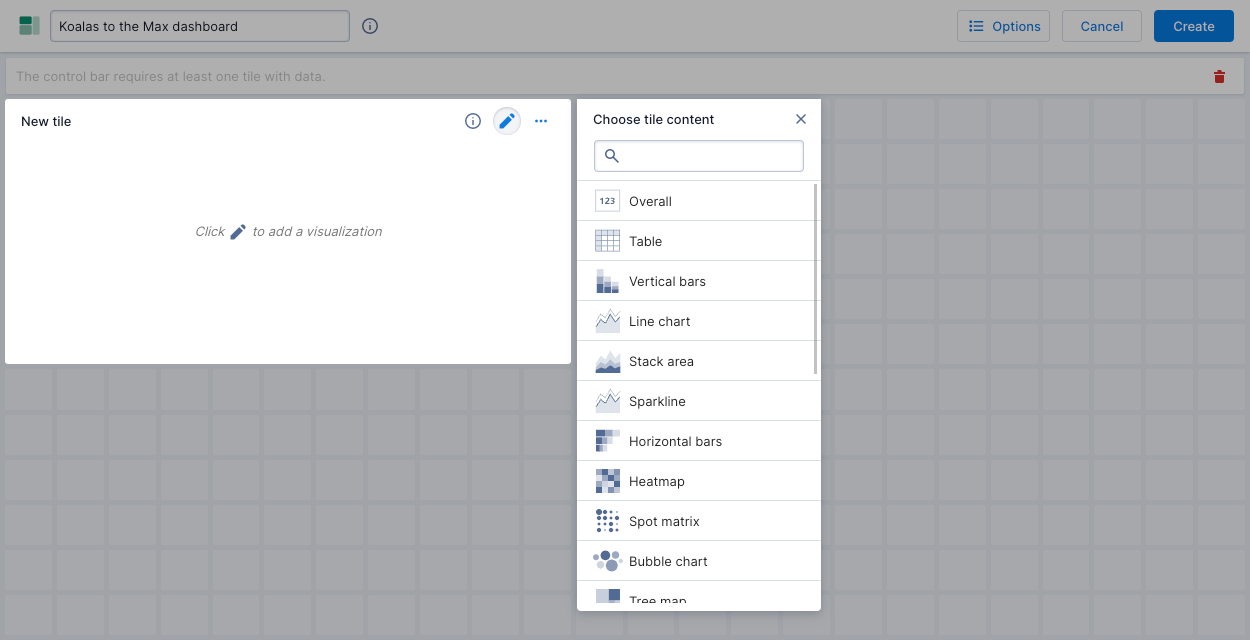
With your mouse or pointer, click and drag across blocks on the page to create a new tile.
In the popup, select content type Table.
From the drop-down list, select the data cube Koalas to the Max.
Add a Row for the Country dimension.
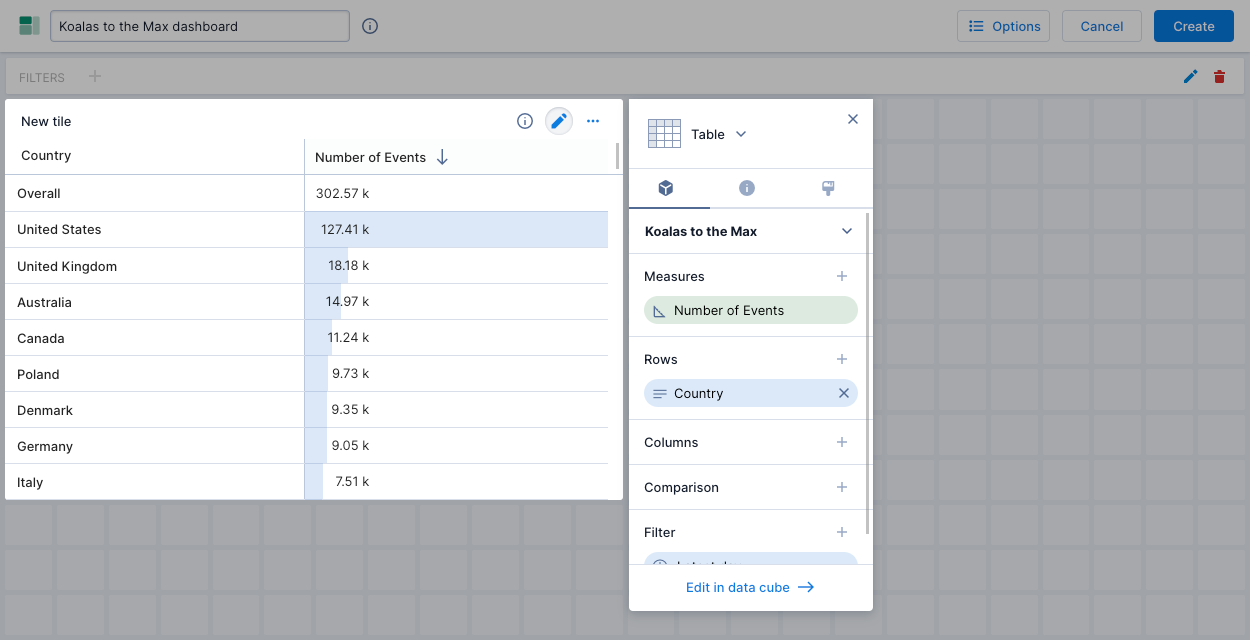
Click elsewhere on the page to close the dialog.
Click Create.
That's it! Continue to explore the Polaris UI, try out your own data, or learn more about creating a schema.
Learn more
See the following topics for more information:
- Navigate the console to learn about the features of the Polaris UI.
- Key concepts for reference on Polaris concepts and terminology.
- Get started with ingestion for an overview of ingesting data into tables in Polaris.
- Guide for analyzing data to learn about using the Polaris APIs to visualize and analyze data.