Integrate with Grafana
You can integrate Imply Polaris with Grafana using the Druid-Grafana plugin developed by grafadruid. The Druid-Grafana plugin extends Grafana by adding the ability to query and visualize data stored in Apache® Druid and Imply Polaris.
Imply doesn't maintain the Druid-Grafana plugin.
Prerequisites
You must have a Polaris API key with the AccessQueries permission. See API key authentication to obtain an API key and assign permissions. Visit Permissions reference for more information on permissions.
If you don't already have a Grafana instance, refer to the official Grafana installation instructions to download a version of Grafana for your operating system or create a Grafana Cloud account.
Install the Druid-Grafana plugin
Install the Druid-Grafana plugin for your Grafana environment as follows.
Local Grafana instance
If you've installed Grafana locally, follow the plugin installation instructions in Installing on a local Grafana.
You may need to restart Grafana after installing the plugin.
Grafana Cloud
For Grafana Cloud instances, log into Grafana Cloud and navigate to the plugins page. Enter Druid in the search bar and select the Druid plugin developed by grafadruid. Click Get plugin then Install plugin.
For more information on plugin management, refer to the Grafana plugins documentation.
Add a Druid data source
Follow these steps to add a Druid data source and connect to Polaris:
-
In Grafana, navigate to Connections > Data sources.
-
Click Add a new data source.
-
Enter
Druidin the connections search bar and select the Druid plugin you installed. If you see more than one Druid plugin, select the one developed by grafadruid. -
Click Add new data source.
-
Configure the data source as follows:
- Name: A name for the Polaris connection.
- URL: Enter your Polaris connection URL in the format:
https://ORGANIZATION_NAME.REGION.CLOUD_PROVIDER.api.imply.io/v1/projects/PROJECT_ID/compat
SetORGANIZATION_NAMEto your Polaris organization name.
ReplaceREGIONwith the cloud region of your Polaris project.
ReplaceCLOUD_PROVIDERwith the cloud service for your Polaris infrastructure.
ReplacePROJECT_IDwith the ID of your Polaris project. - Maximum retry: The maximum number of retries, defaults to
5. - Retry minimum wait (ms): The minimum amount of time to wait before retrying, defaults to
100. - Retry maximum wait (ms) : The maximum amount of time to wait before retrying, defaults to
3000. - Select With basic authentication then enter the following details. See API key authentication for more information on Polaris API keys.
- User: Enter any string.
- Password: Enter your Polaris API key.
-
Click Save & test. If successful Grafana displays the message "Successfully connected to Druid."
If Grafana can't connect, check the following:
- Check that your Polaris connection URL is correct.
- Ensure that your Polaris API key has the
AccessQueriespermission. You can send aGETrequest to the/v1/apikeyinfoendpoint to check the permissions. - If you're hosting Grafana on an internal network, ensure that you have network access to
https://ORGANIZATION_NAME.REGION.CLOUD_PROVIDER.api.imply.io.
Query Polaris with Grafana
After you configure Polaris as a data source, you can use Grafana to run queries and create visualizations against data stored in a Polaris table.
To run a test query against a Polaris table in Grafana Cloud:
- Go to the Polaris data source that you created in Grafana.
- Click Explore data.
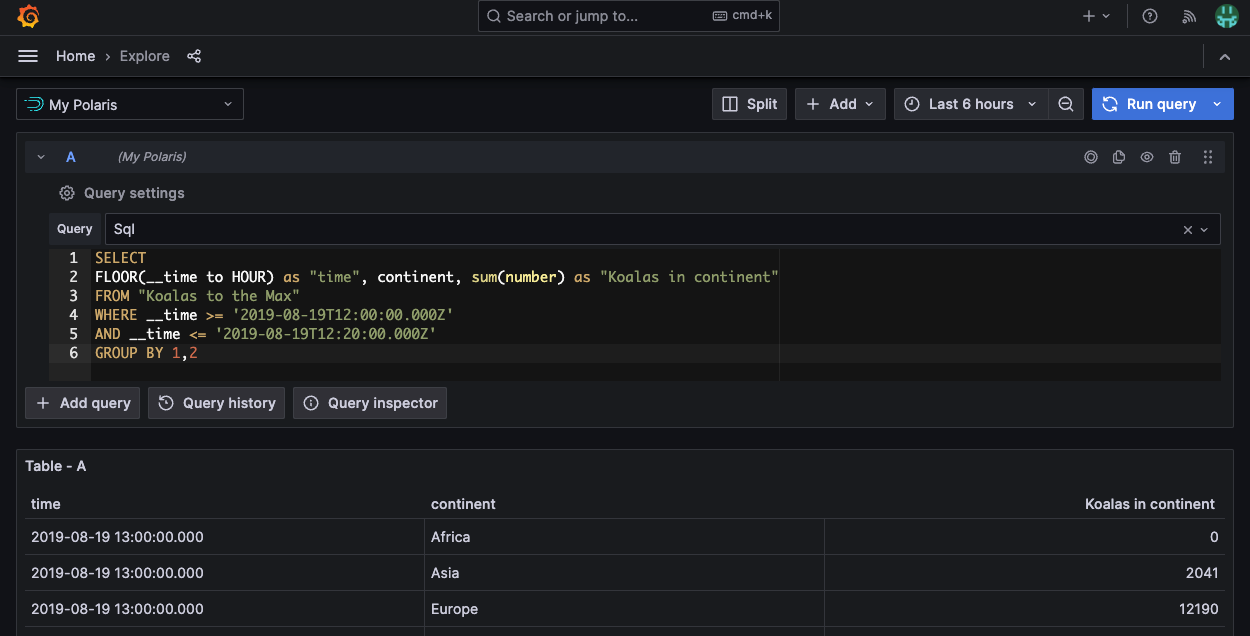
- Set Query to Sql and enter a
SELECT COUNT(*)query in the query editor window, for exampleSELECT COUNT(*) FROM "Koalas to the Max". - Click Run query to execute the query.
- Once the test query successfully returns results, you can start to execute more complex queries.
The following screenshot shows an example SQL query in Grafana Cloud:
If Grafana returns a query error such as An error occurred within the plugin try modifying your query to reduce the amount of data it retrieves. For example, include a filter on time. You can include COUNT(*) in the first row of your query to retrieve some results as a test.
For more information on how to query a data source in Grafana, refer to the Grafana documentation.
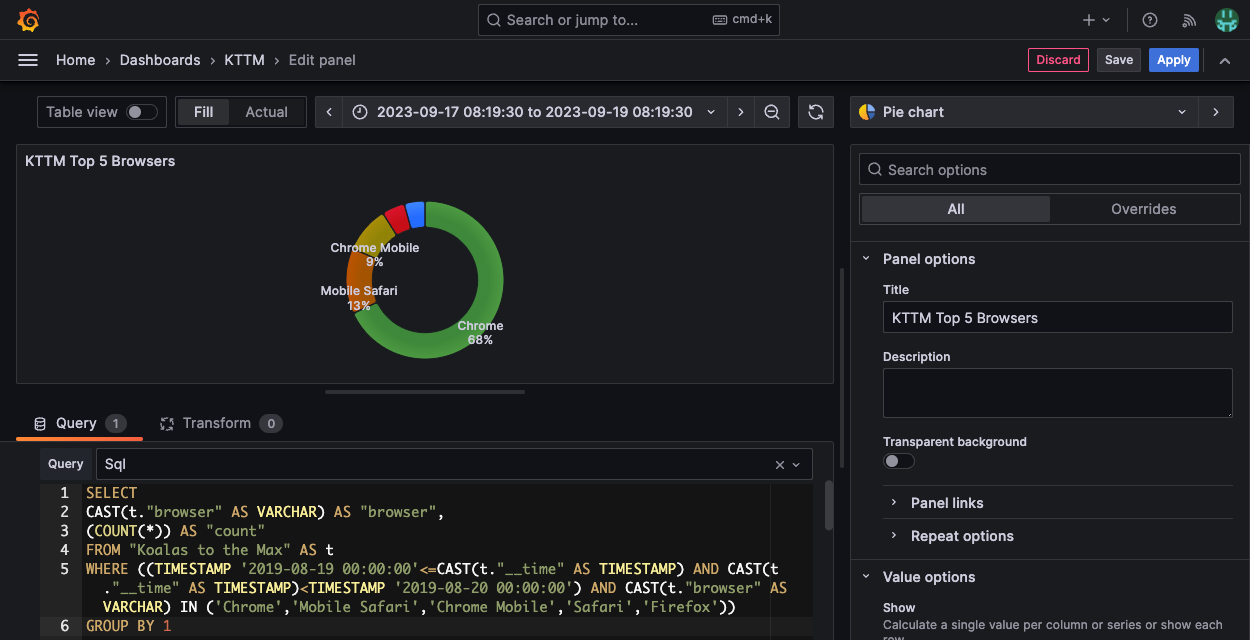
Visualize Polaris data with Grafana
For information on how to create visualizations in Grafana, refer to the Grafana documentation.
The following screenshot shows an example Polaris dashboard in Grafana Cloud:
Learn more
See the following topics for more information:
- Connect from external business intelligence applications for information on other business intelligence tools you can use to explore, query, and share your Polaris data.
- Query data for information on querying data in Polaris.