Embed visualizations
You can use the embedding feature in Imply Polaris to create links to read-only visualizations. You can share links or embed them in third-party apps to provide users outside Polaris with a way to view visualizations outside the Polaris UI.
There are two types of embedding links:
- Public: Simple to set up in the Polaris UI or using the Embedding API, but insecure. Once you create a public link and share or embed it in a third-party app, anyone can access it and view all of its underlying data. See Create an embedding link for details.
- Restricted: Links that can only be accessed when a signature created with a secret key is attached to the URL. A development task is required to generate a secure signature that grants access to the link. See Restrict an embedding link for details.
Prerequisites
Users with the AdministerEmbedLinks permission can configure embedding links in Polaris. For information on permissions, see Permissions reference.
Create an embedding link
Follow these steps to create an embedding link:
-
Click Embedding in the left pane to list all embedding links created in the Polaris UI. Click the API generated tab to see links created with the Embedding API.
-
Click New embedding link.
-
You can create a link to a data cube or to a dashboard:
- To create a link to a data cube, select the data cube and click Configure view. You can add filters, dimensions and measures to restrict the data to include in the embedded view. Click Save when you've finished setting up the view.
- To create a link to a dashboard, select the dashboard and click Save.
Filters you configure at the data cube or dashboard level apply to the default view when a user accesses an embedded visualization. Users can change the filters if they wish, but they can't use any dimensions set as Non-filterable dimensions. To set a filter that users can't change or remove, define an access filter for the embedding link. An access filter takes precedence over data cube and dashboard filters.
-
Complete the Embed View dialog:
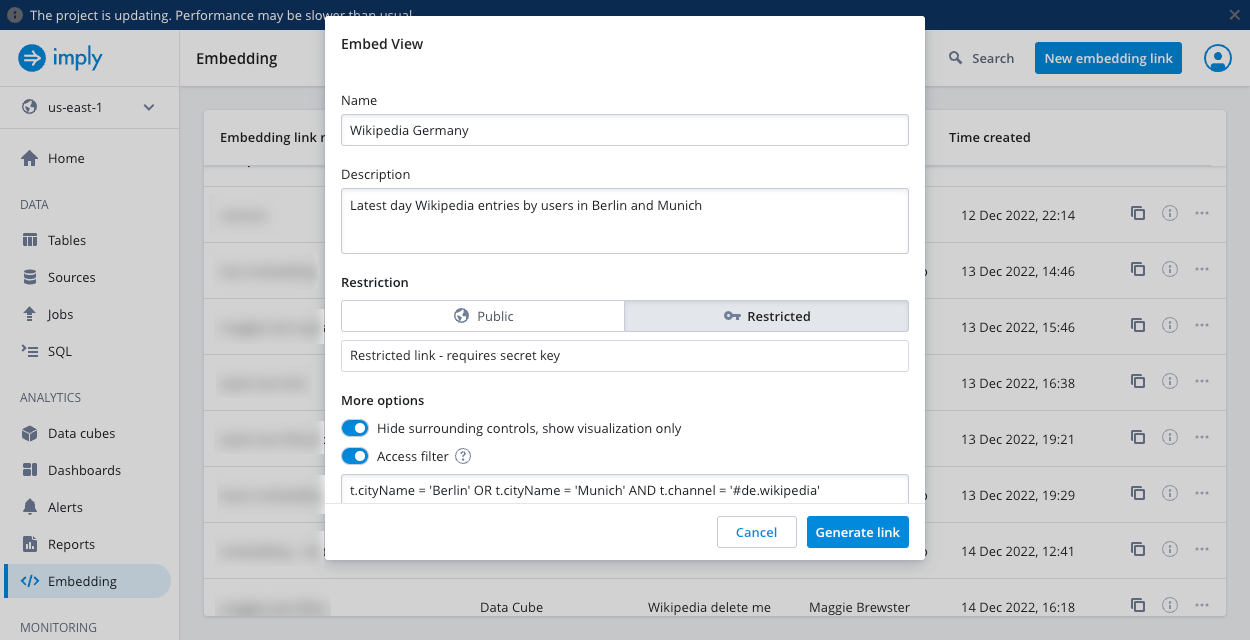
- Name: Enter a name for your embedding link.
- Description: Enter an optional description.
- Restriction: Select Public to create a public link. See Public links for more information.
Select Restricted to create a restricted link. See Restrict an embedding link for more information. - Time to live (TTL): Period of time in milliseconds for which the link is valid, after a user first accesses it. After this period, Polaris presents an error to any user who tries to view the link. There is no limit on the number of milliseconds—set a large number if you want a long period of validity. Applies to restricted links only. Defaults to
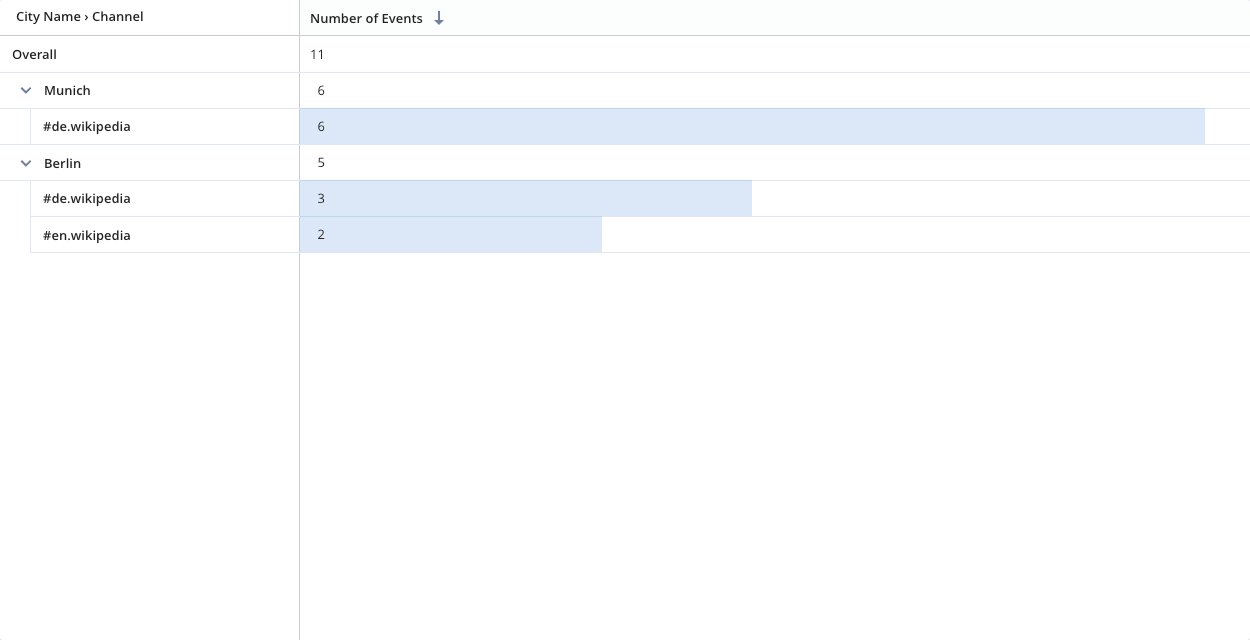
3600000(1 hour). - Hide surrounding controls, show visualization only: Hides the left navigation panel and header bar as shown below:
- Hide fixed time filter: Prevents users from adding a fixed time filter to the embedded visualization.
- Access filter: You can optionally apply a SQL condition to filter the underlying data. Users who access the embedded visualization can't remove this filter. See Create an access filter for a link for more information.
- Non-filterable dimensions: Dimensions to exclude from the filter bar of the embedded visualization.
- Non-showable dimensions: Dimensions to exclude from the show bar of the embedded visualization.
- Non-showable measures: Measures to exclude from the show bar of the embedded visualization.
- Enable downloads: Enable the ability to download data from the embedded visualization. Once turned on, you can set the following:
- Download limit: Set the maximum number of rows a user can download, or select All rows if you don't want to impose a limit.
- Enable async downloads: Enable the async download feature for the embedded visualization. You must already have this feature enabled. See Async download for more information.
- Click the API template tab to copy the API request, if you want to generate the link via API.
-
Click Generate link when you've finished configuring the link.
If you're creating a restricted link, copy the Embed link and the Secret Key. The secret key only appears once and you can't retrieve it later. See Restrict an embedding link for information on how to use the secret key to create a signature and restrict access to a link.infoThe secret key remains valid until revoked. To revoke it, edit the embedding link and either regenerate the secret key or change the link's restriction status to Public. Deleting the link also revokes the secret key.
If you're creating a public link, you can preview the link in a new tab and copy the link to your clipboard.
You can also access the Embedding UI directly from data cubes and dashboards. Click Embed this view from either one, then follow the instructions.
Manage access to embedding links
You can manage access to public links in a limited way. For more control, create restricted links.
Public links
Anyone can access a public link and view all of its underlying data.
If you configure a data cube or dashboard to restrict access to specific Polaris users or groups, these restrictions don't apply to public links. A warning icon appears in Polaris when you create a public link for a restricted data cube or dashboard.
You can, however, create an access filter for a link to limit the data displayed by a public link.
Restricted links
A more secure alternative to a public link is a restricted link. Restricted links can only be accessed when a signature created with a secret key is attached to the URL. You can generate signatures programmatically using the secret key and additional parameters.
You can create an access filter for a link to limit the data displayed by a restricted link. You can also apply a data cube's access filter to a restricted link.
See Restrict an embedding link for more information.
Create an access filter for a link
Access filters allow you to apply a SQL predicate to an embedded visualization's underlying data. Users who access the embedded visualization can't remove this filter.
You can create a single access filter for each link. If you want to create multiple access filters for the same data cube or dashboard, create multiple links.
In the Access filters field for an embedding link, enter a SQL query to select data for the filter. Preface column names with t.—for example, t.cityName = 'Berlin' OR t.cityName = 'Munich' AND t.channel = '#de.wikipedia'.
Manage embedding links
Click Embedding in the left navigation pane to manage embedding links.
For each link, you can:
- Click the Copy icon to save the link to your clipboard.
- Click the View details icon to view information about the link.
- Click the ellipsis to edit or delete the link, or add it to a collection.
Edit a link
Click the name of a link to edit its details:
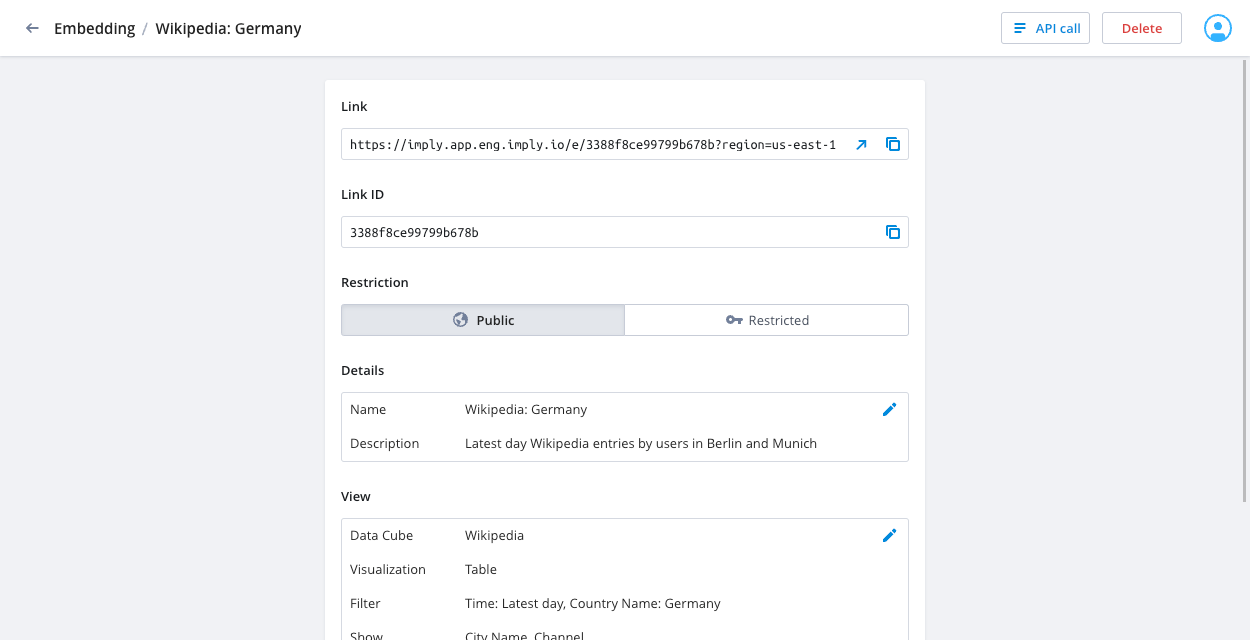
After you edit and save the link fields, you can click API call at the top of the page to view and copy the updated API request.
Embed a public link
Once you have your public link or API request, you can use it to embed a webpage or app to provide read-only access to the visualization.
The URL format is as follows:
https://ORGANIZATION_NAME.app.imply.io/e/REGION:CLOUD+PROJECT_ID+EMBED_LINK_ID
For example, you could embed a link in a webpage using an iframe tag as follows:
<iframe src="https://example.app.imply.io/e/us-east-1:aws+adc305e1-2e77-40df-805f-ef0f6cd4f164+34392300657dc3c5d0/" title="Example public embedded visualization"></iframe>
Learn more
See the following topics for more information:
- Manage data cubes for creating and editing data cubes.
- Visualize data for using Polaris visualization features to draw insights from your data.
- Embedding API for information on creating and managing embedded links via the API.
- Restrict an embed link for details on how to create restricted embedding links.